
RESEARCH BRIEF | Children | November 2023
THE 2020 CENSUS UNDERCOUNT OF YOUNG CHILDREN IN TEXAS COUNTIES
In partnership with Dr. Bill O’Hare, Count All Kids, this research brief estimates the 2020 Census undercount of Texas young children by county and studies county-level and regional patterns across the state to enable thorough analysis and informed decision-making.
By: Dr. Francisco A. Castellanos-Sosa, Texas Census Institute, Senior Research Associate
Dr. William P. O’Hare, Count All Kids Campaign, Consultant
The Children’s Census Initiative
The Texas Census Institute created the Children’s Census Initiative to improve the accuracy with which the 2030 Census will count Texas children. The initiative comprises five related parts, each tackling a specific aspect of this phenomenon to enable a thorough analysis and informed decision-making. This research brief is the third product of the initiative. Its objective is to demonstrate the undercount of young children, age 0-4, by county in Texas. In addition to the already published research on the child undercount in Texas (age 0-17) by county and counties with a high child undercount, upcoming research in this initiative includes a look at the funding implications of the child undercount due to a loss of federal dollars, and the potential determinants of the undercount. Collectively, this initiative will offer valuable insights and recommendations for addressing the U.S. Census child undercount and empowering stakeholders with the knowledge for effective decision-making and action.
Research Overview
Estimates suggest the 2020 Census undercounted 155,855 Texas young children in net terms (7.9% of Texas children). While these state-level numbers are informative, some counties experienced much higher undercount rates. To better understand this issue, we examine the 2020 county-level high net young child undercount in Texas and study its spatial distribution using data from the 2020 Census and the Vintage 2020 Population Estimates. This study builds on the work of Dr. William P. O’Hare, who finds Texas had more counties with high net undercounts of young children than any other state (either in number or rate terms).
Main Findings
Of the 1,975,115 young children in Texas reflected in the Vintage 2020 Population Estimates, the 2020 Census undercounted 155,855 young children (7.9%).
184 of 254 Texas counties (72.4%) had a high net young child undercount (rate, number, or both).
85.8% of Texas young children live in a county with a high undercount (rate, number, or both).
Of the 184 Texas counties with a high net young child undercount, 31 Texas counties had a high net young child undercount rate and number, with a net 134,421 young child undercount (9.5% of their children).
12 of the 14 Texas counties on the U.S.-Mexico border have high net young child undercounts (rate, number, or both).
Altogether, the 14 counties on the U.S.-Mexico border have a net young child undercount of 31,666 (15.2% of their young children).
Figure 1 Net undercount rate for children’s age groups: 1970-2020.
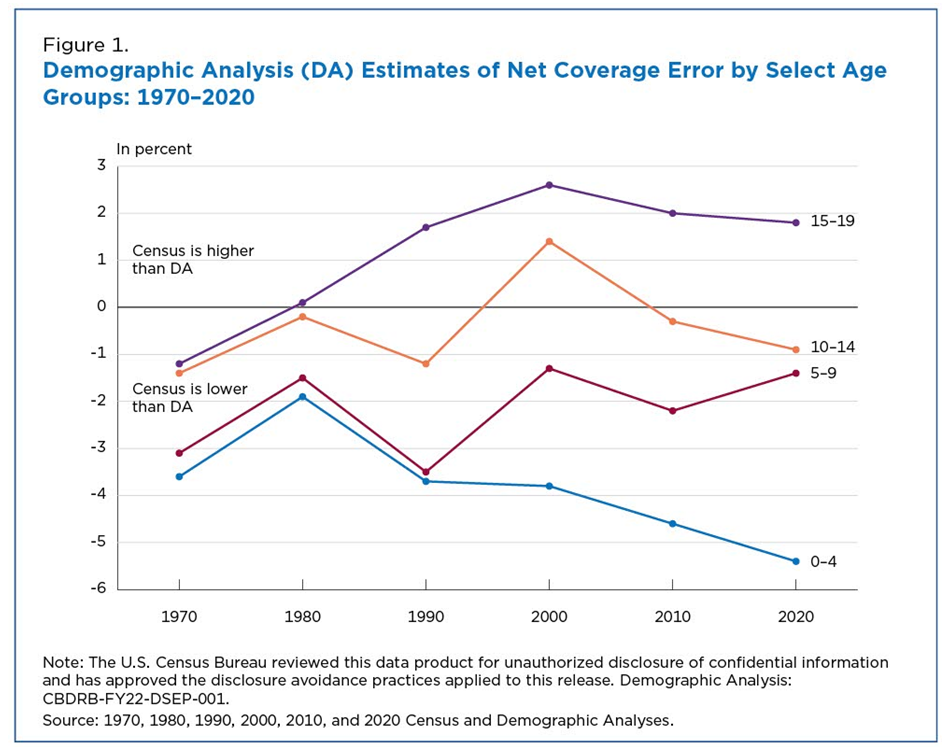
Source: Jensen, E. B. Census Bureau Expands Focus on Improving Data for Young Children. United States Census Bureau. U.S. Census Bureau. America Counts Series (2022).
Note: Negative and positive values indicate net undercounting and net overcounting, respectively.
Our Contribution
“Young children ages 0 to 4, a historically undercounted population in decennial censuses, continued to be undercounted in the 2020 Census despite major efforts by the U.S. Census Bureau to mitigate this problem.”3 The coverage errors of the Demographic Analysis (DA) by individual years of age indicate undercounts for most children, with the most significant undercounts observed in the 0–4 group. However, little is known about young children undercounting at the county level.4–9 To inform this issue, we estimated the Texas county-level net young children undercount and studied its spatial distribution using data from the 2020 Census and the Vintage 2020 population estimates.
Introduction
The Decennial Census is the foundation of our national statistical system, and census data are widely used in the public and private sectors. One of the most important uses of census data is in federal and state funding formulas that distribute billions of dollars to communities in Texas every year.10 For instance, the Project on Government Oversight (POGO) recently found that census-derived data were instrumental in geographically distributing $2.1 trillion in federal funding to Texas in Fiscal Year 2020.11 None-the-less, the census is not perfect. Some groups of people are not counted, while others are overcounted. Groups and localities with high net undercount rates are not likely to receive their fair share of public resources. Census net undercounts also hinder effective planning, risking waste or misdirection of taxpayer funds.
The Decennial Census is the foundation of our national statistical system, and census data are widely used in the public and private sectors. One of the most important uses of census data is in federal and state funding formulas that distribute billions of dollars to communities in Texas every year.10 For instance, the Project on Government Oversight (POGO) recently found that census-derived data were instrumental in geographically distributing $2.1 trillion in federal funding to Texas in Fiscal Year 2020.11 None-the-less, the census is not perfect. Some groups of people are not counted, while others are overcounted. Groups and localities with high net undercount rates are not likely to receive their fair share of public resources. Census net undercounts also hinder effective planning, risking waste or misdirection of taxpayer funds.
Figure 1 Net undercount rate for children’s age groups: 1970-2020.
Source: Jensen, E. B. Census Bureau Expands Focus on Improving Data for Young Children. United States Census Bureau. U.S. Census Bureau. America Counts Series (2022).
Note: Negative and positive values indicate net undercounting and net overcounting, respectively.
By studying the Texas case, this study builds upon O’Hare’s research on high county-level net undercounts of young children in the 2020 U.S. Census.18 This research brief also builds upon the recent work of Castellanos-Sosa and O’Hare on the 2020 children undercount in Texas by focusing now on young children only and exploring the counties where this phenomenon is considerably worse.1,2
This study focuses first on all counties and then only on counties with high net young child undercounts. The latter makes it more likely to identify the correct direction of net young child undercount, even if we cannot yet pinpoint the magnitude. Given the potential small random errors in the 2020 Census and the Vintage 2020 Population Estimates, a small difference between them might not necessarily reflect a true net undercount or an overcount. While small net undercounting can be important, our contribution relies on identifying the Texas counties where the net young child undercount could be considered a serious problem.
This is noteworthy for two reasons. First, data analysts and researchers, particularly those with local knowledge, can use this set of counties to better understand the high net young child undercount. Second, in the absence of more updated information, these counties can be used for targeting outreach and resources during the planning and implementation of the 2030 Census.
Data and Methodology
This brief follows Castellanos-Sosa and O’Hare’s approach to estimating net young child undercounts at the county level. In it, we compare the county-level young child estimates from the Vintage 2020 Population Estimates to the 2020 Census.
Texas counties’ net young child undercount is classified as high based on two thresholds: net undercount rates above 5.0% and net undercount numbers above 500 young children. To be inclusive of a few counties just below this threshold and avoid discarding them inquisitively, we also considered nine counties with an undercount rate above 4.5%. The threshold of 5.0% is similar to the nation’s undercount rate for the population aged 0 to 4, which was 5.4%, according to the DA. In the Census Bureau data released in March 2022, which provided census coverage measures at the national level, only three groups (Hispanics, young children (aged 0 to 4), and American Indian and Alaskan Natives living on Indian reservations) had net undercount rates of 5% or more.
In addition, Eric Jensen and Sandra Johnson from the U.S. Census Bureau have used the 5% threshold to study differences between the census and the 2020 Vintage Population estimates for young children.19 Finally, only 283 out of 3,136 counties had a net young child undercount (aged 0-4) of 500 children or more.18
Results
The 2020 Census reported 1,819,260 people under age five in Texas, while the Vintage 2020 population estimate for the same age group is 1,975,115. In other words, the 2020 Census count is 155,855 lower and reflects a net young child undercount rate of 7.9%. Since state-wide numbers can mask big differences within a state the size of Texas, it is vital to study these figures at the county and regional level.
County-level Analysis
 We estimate that 155,855 out of 1,975,115 young children (7.9%) in the Texas 2020 Vintage population estimates were undercounted by the 2020 Census. The full data table by county and visualization tools on net young children undercount are available at texascensus.org. Texas counties experienced an average young child undercount of 613 children and an average rate of 7.7% by county; however, the young child undercount in Texas counties ranges from a net undercount of 29,865 in Harris County (located in the Gulf Coast region) to a net overcount of 1,024 in Coryell County (located in the Central Texas region).
In terms of net coverage rates, Texas counties range from a net young child undercount of 55.6% in Loving County (in the West Texas region) to a net young child overcount of 115.4% in Jeff Davis County (in the Upper Rio Grande region). It is relevant to remember that the small population of some counties might translate any undercount into a high rate. Harris County, with almost five million people, is the most populated Texas county, with a net young child undercount rate of 8.7%. On the other side, Loving County experienced Texas’ highest net young child undercount rate (55.6%) by undercounting only five young children.
Figure 2 shows that 219 Texas counties experienced a net young child undercount (87.4%), and 32 observed an overcount (12.6%). Panel a) in Figure 2 shows how net young child undercount numbers tend to be higher in counties in the South Texas region and the Texas Triangle (the area embraced by Austin, Dallas–Fort Worth, Houston, and San Antonio). Panel b) in Figure 2 accentuates some of these patterns. For instance, it shows how the net undercounted children rate is predominantly higher in counties on the U.S.-Mexico border and those close to it. In particular, high net young child undercount rates tend to cluster in the South Texas and West Texas regions.
Regional Analysis
 The county-level clustering observed in Figure 2 raises different questions. For instance, is the young children undercount a regional phenomenon? When estimating the highest net young child undercount in numbers by region, we find it concentrated in the Gulf Coast, Metroplex, and South Texas regions (see Figure 3). Seven of every ten young children undercounted in Texas are from these three regions, with a combined young child undercount of 104,648 (67.1% of the 155,855 young children undercounted in the state).
Roughly one of every four young children undercounted in Texas is from the Gulf Coast region, with an undercount of 40,031, (25.7% of the state’s young child undercount). Similarly, almost one of every four young children undercounted in Texas is from the Metroplex region, with an undercount of 34,811 (22.3% of the state’s young child undercount). Moreover, one of every five young children undercounted in Texas is from the South Texas region, with an undercount of 29,806 (19.1% of the state’s young child undercount).
When studying the young child undercount rates by region, Figure 4 shows how the young child undercount rate is predominantly higher in the South Texas, West Texas, and Upper Rio Grande regions, which contain all of the Texas counties in the U.S.-Mexico border.
The relatively higher young child undercount rate in some regions like the U.S.-Mexico border might arise because their counties have a smaller young child population; causing total young child undercounts indicate a higher rate. In sum, the geographical dispersion of counties’ and regions’ young child undercount rates provide suggestive evidence of higher young child undercounts close to the U.S.-Mexico border and in the Gulf Coast and Metroplex regions. Indicating that a deeper regional exploration of the determinants of young child undercounts is necessary to identify a set of definite explanations for this phenomenon.
An exploration of the high numbers and rates of young children undercount
 Table 1 shows three statistics regarding net young child undercount in the 219 Texas counties experiencing it. These include the number of counties and the net young child undercount numbers and rates for each specific group of counties. The data are categorized based on low and high numbers and rates, with additional information for the entire low and high categories.
The net young child undercount number in the 219 counties experiencing any undercount is naturally higher than the state number because the state figure is the net of undercount and overcount. Together, these 219 counties experienced a net undercount of 159,212 young children.
Of the 219 counties, 184 experienced a high rate, a high number, or both (72.4% of Texas counties). One hundred and eighty counties experienced only a high rate, and 35 had only a high number. The overlapping category—high rate and high number—comprises 31 counties, which are highly undercounted.
The 31 highly-undercounted counties had a net undercount of -134,421 young children, representing 84.4% of the net young child undercount happening in the 219 counties with any level of this phenomenon. This number represents 9.5% of the young children in those counties (almost two times the national rate of 5.4%).

The 31 highly undercounted counties are not necessarily the ones with the highest rate. For instance, the 149 counties with a low number and a high rate present the highest rate (10.3%) of the four subgroups. Hence, about one in every ten young children is undercounted in those counties.
 It should also be noted that most counties with a net young child undercount estimate of 5.0% or more have undercounts more than double of 5.0%. High net young child undercount rates and numbers are found in every region of Texas. However, highly undercounted counties tend to be clustered along the U.S.-Mexico border (see Figure 5). Of the 14 Texas counties on the Mexican border, 12 have high net young child undercounts (in terms of rates, numbers, or both).
The collective young child net undercount in border counties is 31,666, representing 15.2% of their young child population. Of the net young child undercount in the 219 counties with any net young child undercount, 19.9% is accounted for by the counties on the U.S.-Mexico border. In other words, one out of every five net young child undercounts occurs in a border county.
The high proportion of net young child undercounts happening in a few counties might be related to factors happening in them. So, the phenomenon on the border seems to deserve further exploration itself.20
Among border counties, 12 of 14 counties (all but Terrell County and Jeff Davis County) had a net young child undercount. Seven of them experienced a high net young child undercount number and rate (Cameron, El Paso, Hidalgo, Maverick, Starr, Val Verde, and Webb). The full table by county and data on net young child undercount by county are available at texascensus.org.
Concluding Remarks
The data examined here indicate that the undercount rate for the population aged 0 to 5 in the 2020 Census (also known as young children) is a substantial issue across a large number of Texas counties. Altogether, there are 184 counties in Texas with either a high net young child undercount rate or number. Strikingly, about 85.8% of all young children in Texas live in a county of this type.
There were 180 counties with a rate above 5.0%, 35 counties with a number above 500, and 31 counties with a high net young child undercount rate and number.
The findings provided in this brief aim to contribute to our understanding of the quality of the 2020 Census at a more granular level since state-level measures often mask large differences among counties. Absent more updated information, the information in this study can be used to start targeting outreach and promotion to improve the count of young children in the 2030 Census.
This information about where the undercounts of young children are the highest in Texas could help the U.S. Census Bureau and census stakeholders prepare for the 2030 Decennial Census. The data presented in this study are useful to pinpoint the types of places that deserve special attention in the 2030 Census concerning the count of young children. This report may serve as a model for other states to understand their net young child undercounts.
Finally, researchers could also use these findings as a starting point to examine the characteristics that distinguish counties with high net young child undercounts from other counties. Identifying those characteristics may help us reduce net young child undercounts in the 2030 Decennial Census by addressing its root causes.
Author’s Message
The net undercount of young children (age 0 to 4) in the U.S. Census is high and has been growing in recent decades. This study provides a detailed analysis of high young child undercounts at the county level in Texas and explores its regional patterns. These results can serve as a roadmap for deeper analysis.
Census-related data are used to determine the distribution of funding for 350+ federal programs, totaling more than $2.8 trillion each year. Counties with an undercount will not receive the full federal funding to which they are entitled, impacting budgets for things like schools, health centers, and childcare centers. Furthermore, counties with an undercount will not have accurate data for future planning.
To address the impact of an undercount, leaders may want to explore ways to compensate counties that experience a high undercount of children. Similarly, leaders in counties with a high undercount of young children may want to work with the Census Bureau to look for additional ways to correct the undercount of young children in future censuses. The results shown here can be used to start building a targeted approach to increasing the count accuracy of young children in the 2030 Census.
Acknowledgements: The authors appreciate the insightful support provided by Helen You, Deborah Stein, and Monica Cruz.
FAQ
1) Why does the U.S. Census Bureau not publish undercounting and overcounting estimates at the county level for children?
As it is well known, the U.S. Census Bureau assesses the quality (undercounting or overcounting) of its Decennial Census using the Post-Enumeration Survey (PES) and the Demographic Analysis (DA).
The PES was implemented in 2020 by characteristics of the housing units only to the national and state levels. The PES uses the location of the housing units to obtain results at the subnational level, but it does not consider demographic characteristics such as age or gender. Moreover, “…the sample size for the 2020 PES and the assumptions required to make unbiased sub-state estimates, the Census Bureau was unable to include county or place estimates in the 2020 PES reports, as well.” (U.S. Census Bureau, 2022).
On the other hand, the Demographic Analysis uses “…current and historical vital records, data on international migration, and Medicare records to produce national estimates of the population on April 1 by age, sex, the DA race categories, and Hispanic origin.” (U.S. Census Bureau, 2022). While the DA is rich in demographic characteristics, it cannot identify the current place of residence of the population since a great part of it is based on vital records. Therefore, due to its nature, the official undercounting or overcounting by demographic characteristics is estimated at the national level only.
Therefore, it is not possible to obtain an official undercounting and overcounting estimate at the county level for children.
2) Why are we using counties as geographies?
This approach implies that undercounting estimation is built upon variables that are considered determinants of undercounting, according to the theory.
3) How accurate or precise are our net child undercount estimates?
While there is no statistical measure of accuracy or precision for our estimates, they were built using official publicly available data from the U.S. Census Bureau.
4) Why are we focusing on counties with high net child undercounts?
Given the potential small random errors in the 2020 Census and the Vintage 2020 Population Estimates, a small difference between them might not necessarily reflect a true net undercount or an overcount. While small net undercounting can be important, our contribution relies on identifying the Texas counties where the net child undercount could be considered a serious problem. By focusing only on counties with high net child undercounts, we are more likely to identify the correct direction of net child undercount.