
Learn How to Engage with Congressional Offices about the Census – Read the Manual Here.
RESEARCH BRIEF | Children | September 2023
TEXAS COUNTIES WITH HIGH CHILD UNDERCOUNTS IN THE 2020 U.S. CENSUS
In partnership with Dr. Bill O’Hare from Count All Kids, this research studies Texas counties’ high rates and numbers of child undercounting in the 2020 Census.
By: Dr. Francisco A. Castellanos-SosaA, Texas Census Institute, Senior Research Associate
Dr. William P. O’Hare, Count All Kids Campaign, Consultant
The Children’s Census Initiative
The Texas Census Institute created the Children’s Census Initiative to improve the accuracy with which the 2030 Census will count Texas children. The initiative comprises five related parts, each tackling a specific aspect of this phenomenon to enable a thorough analysis and informed decision-making. This research brief is the first product of the initiative, and its objective is to serve as a descriptive overview of child undercounts in the state by providing an innovative measurement of children’s undercount in Texas counties and regions. The following four topics are part of this initiative and will study 1) the counties with high net child undercount in Texas, 2) the determinants of Texas child undercount, 3) its economic impact, and 4) its short-and long-term implications. Collectively, this initiative will offer valuable insights and recommendations for addressing the U.S. Census child undercount and empowering stakeholders with the knowledge for effective decision-making and action.
Research Overview
Estimates suggest the 2020 Census undercounted 153,633 Texas children in net terms (2.1% of Texas children). While these state-level numbers are informative, some counties experienced much higher undercount rates. To inform this issue, we examine the 2020 county-level high net child undercount in Texas and study its spatial distribution using data from the 2020 Census and the Vintage 2020 Population Estimates. This study builds on the work of Dr. William P. O’Hare, who finds Texas had more counties with high net undercounts of children than any other state (either in number or rate terms).
Main Findings
In the 2020 Census, children in Texas experienced a 2.1% net undercount.
In Texas, 117 of 254 counties (46.1%) had a high net undercount of children (rate, number, or both).
65.7% of Texas children live in a county with a high net child undercount (rate, number, or both).
In Texas, 30 counties (11.8%) had a high net child undercount rate and number, with a net 92,679 child undercount, which is 6.4% of their children.
30 counties had a high net child undercount rate and number, accounting for 46.7% of the net child undercount that occurs among the 190 counties with a net child undercount.
Counties with a high percentage of undercounted children and a low undercount number have the highest net child undercount rates (9.1%) from the four paired categories of high and low net child undercount rates and numbers.
11 of the 14 Texas counties on the U.S.-Mexico border have high net child undercounts (rate, number, or both).
The 14 counties on the U.S.-Mexico border have a net child undercount of 37,892 children (24.7% of the net child undercount in Texas).
Figure 1 Net undercount rate for children and adults:1950-2020

Note: Negative and positive values indicate net undercounting and net overcounting respectively.
Figure 2 Texas’ counties net child undercount rates and numbers.
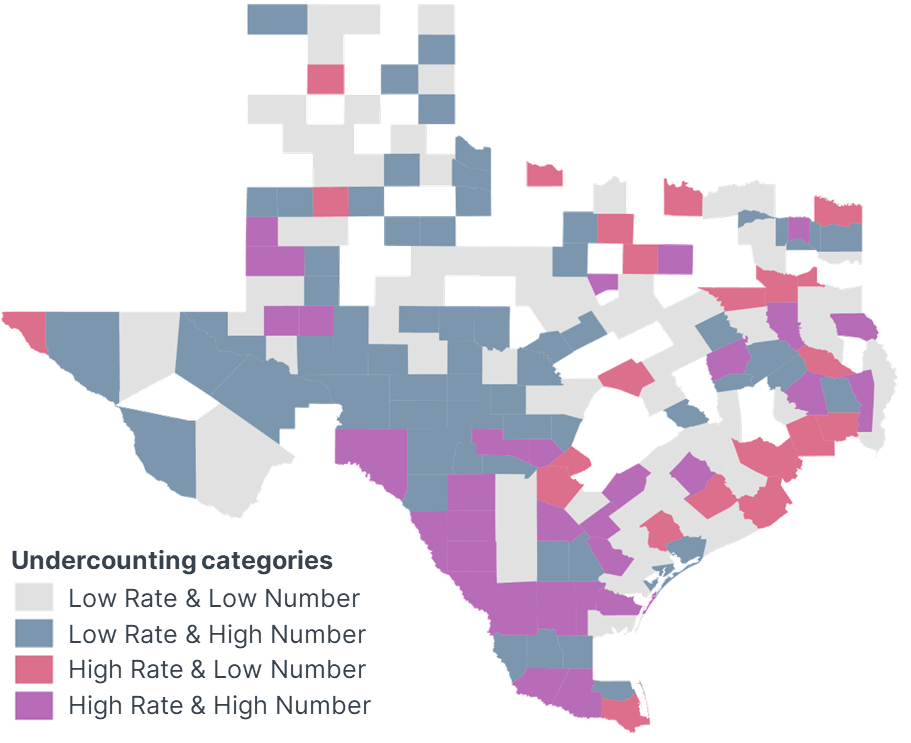
Note: Uncolored counties experienced a net child overcounting.
Our Contribution
Several previous undercounting studies focus on subnational accuracy assessments of the U.S. Census.2–7 However, their results are limited concerning patterns and geographically disaggregated information on the undercount of children (ages birth to 17). Therefore, we examine the 2020 county-level high net child undercount in Texas and study its spatial distribution using data from the 2020 Census and the Vintage 2020 Population Estimates.
Introduction
The Decennial Census is the foundation of our national statistical system, and census data are widely used in the public and private sectors. One of the most important uses of census data is in federal and state funding formulas that distribute billions of dollars to communities in Texas every year.8 For instance, Andrew Reamer found that Census-derived data was instrumental in $102 billion in federal funding to Texas in Fiscal Year 2017 for schools, health care, and roads.9
However, the census is not perfect. Some groups of people are not counted, while others are overcounted. Groups and localities with high net undercount rates are not likely to receive their fair share of public resources. Census net undercounts also hinder effective planning, risking the waste or misdirection of taxpayer funds.
One of the groups missed at a high rate is children (2.1%). TxCI has chosen to focus special attention on children and the census because the net undercount of children in the census is high and has worsened in recent decades. Figure 1 shows the net undercount rates for children and adults since 1950.
In the 1990 Census, the net undercount rate for adults and children was very similar (-1.6 percent for adults and -1.8 percent for children). By 2020, a large gap had emerged, the widest difference ever recorded. In the 2020 Census, adults had a net overcount of 0.3% compared to a net undercount rate of 2.1% for children.
Figure 1 Net undercount rate for children and adults:1950-2020
Note: Negative and positive values indicate net undercounting and net overcounting respectively.
Given the relatively high nationwide net undercount rate for children, it would be useful to understand better the geographic distribution of problems in census coverage for children. Such an analysis might help pinpoint the determinants of the high and increasing net undercount. It may also help us better understand which children are most vulnerable to being missed. This analysis helps inform plans for targeting and outreach activities in the 2030 Census by both the U.S. Census Bureau and outside stakeholders seeking to improve the census quality at the sub-state level.10–15
At the state level, Texas is an outlier regarding child net undercounts. Dr. William P. O’Hare found that Texas had 117 counties with a high net undercount of children (either a high rate, high number, or both). This number is much larger than in any other state.16 The next states in this category are North Carolina, Georgia, Oklahoma, and Mississippi, with 36, 30, 27, and 23 counties. Regarding the share of counties with an undercount in each state, Texas also leads with 46.1%. NC, GA, OK, and MS have 36.0%, 18.9%, 35.1%, and 28.0%, respectively. O’Hare also found that Texas had more counties with high net child undercount numbers and high undercount rates (30%). More details about the thresholds to define a high net undercount and highly-undercounted counties may be found in the next section.
By studying the Texas case, this study builds upon O’Hare’s research on high county-level net undercounts of children in the 2020 U.S. Census.16 This research brief also builds upon the recent work of Castellanos-Sosa and O’Hare on the 2020 children undercount in Texas by studying those counties where this phenomenon is considerably worse.1
By focusing only on counties with high net child undercounts, we are more likely to identify the correct direction of net child undercount, even if we cannot yet pinpoint the magnitude. Given the potential small random errors in the 2020 Census and the Vintage 2020 Population Estimates, a small difference between them might not necessarily reflect a true net undercount or an overcount. While small net undercounting can be important, our contribution relies on identifying the Texas counties where the net child undercount could be considered a serious problem.
This is noteworthy for two reasons. First, data analysts and researchers, particularly those with local knowledge, can use this set of counties to understand the high net child undercount. Second, in the absence of more updated information, these counties can be used for targeting outreach and resources during the planning and implementation of the 2030 Census.
Data and Methodology
This brief follows O’Hare’s approach to estimating net child undercounts at the county level. We compare the county-level child estimates from the Vintage 2020 Population Estimates to the 2020 Census.
Texas counties’ net child undercount is classified as high based on two thresholds: net undercount rates above 5.0% and net undercount numbers above 500 children. A 5% is more than twice the nation’s undercount rate for the population aged 0 to 17, which was 2.1%. In the Census Bureau data released in March 2022, which provided census coverage measures at the national level, only three groups (Hispanics, young children (aged 0 to 4), and American Indian and Alaskan Natives living on Indian reservations) had net undercount rates of 5 percent or more. In addition, Eric Jensen and Sandra Johnson from the U.S. Census Bureau have used the five-percent threshold to study differences between the census and the 2020 Vintage Population estimates for children.17 Finally, only 225 out of 3,142 counties (7.2%) had a net child undercount of 500 children or more.16
Results
The 2020 Census reported 7,278,805 people under age 18 in Texas, while the Vintage 2020 population estimates for the same age group is 7,432,438.1 In other words, the 2020 Census count is 153,633 lower and reflects a net child undercount rate of 2.1%. Since state-wide numbers can mask big differences within a state the size of Texas, it is vital to study these figures at the county level.
Net child undercount rates range from 0.01% in Fort Bend (in the Gulf Coast region) to 53.8% in Loving County (in the West Texas region; and also the county with the smallest population in Texas). Interestingly, in numbers, Fort Bend had 230 undercounted children and Loving 28. It is important to understand that the small population of some counties might translate any undercount number into a high rate. Harris County (located in the Gulf Coast region), with almost five million people, is the most populated Texas county and has a net child undercount rate of 2.8%. Its rate is equivalent to 34,909 undercounted children, more than the entire population of the 165 less-populated Texas counties, according to the Vintage 2020 estimates.
From an overarching perspective, most Texas counties experienced an undercount (190 out of 254, which is 74.8% of the counties). As found by O’Hare, Texas has 117 counties (46.1% of the counties) with a high net undercount of children (either a high rate, a high number, or both).16 Our analysis dissects this big undercounted group of counties into four subgroups according to low and high values of rates and numbers: 1) low rate and low number (73 counties), 2) low rate and high number (22), 3) high rate and low number (65), and 4) high rate and high number (30).
Table 1 shows three statistics regarding net child undercount in the 190 Texas counties experiencing it. These include the number of counties and the net child undercount numbers and rates for each specific group of counties. The data is categorized based on low and high numbers and rates, with additional information for the entire low and high categories.
The net child undercount number in the 190 counties experiencing any undercount is naturally higher than the state number because the state figure is the net of undercount and overcount. Together, these 190 counties experienced a net undercount of 198,638 children.
Table 1 Texas counties with a net child undercount.

Of the 190 counties, 117 experienced a high rate, a high number, or both. Ninety-five counties experienced a high rate, and 52 had a high number. The overlapping category—high rate and high number—comprises 30 counties, which are highly undercounted.
The 30 highly-undercounted counties had a net undercount of 92,679 children, representing 46.7% of the net child undercount happening in the 190 counties with any level of this phenomenon. This number represents 6.4% of the children (more than three times the national and state-level rate of 2.1% each). When studying the average of these values at the county level, we observe 3,089 child undercounts at a 10.2% average rate. This rate is nearly five times the 2.1% for the U.S. and Texas.
The 30 highly-undercounted counties are not the ones with the highest rate, average rate, or highest average number. For instance, the 65 counties with a low number and a high rate present the highest rate (9.1%) and average rate (12.2%) of the four subgroups. Hence, about one in every ten children is undercounted in those counties. The highest average net child undercount number (3,841) occurs in counties with a low rate and a high number of this phenomenon.
It should also be noted that most counties with a net child undercount estimate of 5.0% or more have undercounts much higher than 5.0%. Of the 95 Texas counties with a high net child undercount, 43 counties have net child undercounts above 10.0%. Of the 52 counties with a high net child undercount greater than 500, 43 have net child undercounts above 1,000.
High net child undercount rates and numbers are found in every region of Texas. However, highly-undercounted counties tend to be clustered along the U.S.-Mexico border (see Figure 2). Of the 14 Texas counties on the Mexican border, 11 have high net child undercounts (in terms of rates, numbers, or both).
The collective child net undercount in border counties is 37,892, representing 4.9% of their child population. Of the net child undercount in the 190 counties with any net child undercount, 19.1% is accounted for by the counties on the U.S.-Mexico border. In other words, one out of every five net child undercounts occur in a border county. The high proportion of net child undercounts happening in a few counties might be related to factors happening in them. So, the phenomenon on the border seems to deserve further exploration itself.18
Figure 2 Texas’ counties net child undercount rates and numbers.
Note: Uncolored counties experienced a net child overcounting.
Among border counties, all but Terrell County and Jeff Davis County had a net child undercount. Of the other 12 counties on the border, Brewster County had both low net child undercount rates and numbers. Five counties (Hidalgo, Webb, Val Verde, Starr, and Maverick) had a high net child undercount rate and number. Four counties had a high rate and low number (Hudspeth, Zapata, Presidio, and Kinney), and two counties (Cameron and El Paso) experienced a high net child undercount number and a low rate. The full table by county and data on net child undercount by county are available at texascensus.org.
Concluding Remarks
The data examined here indicates that the undercount rate for the population aged 0 to 17 in the 2020 Census is a substantial issue across counties in Texas. There is a large number of Texas counties that have high net child undercounts. Altogether, there are 117 counties in Texas (46.1% of Texas counties) with either a high net child undercount rate or number. Strikingly, about 65.7% of all children in Texas live in a county of this type.
There were 95 counties with a rate above 5.0%, 52 counties with a number above 500, and 30 counties with a high net child undercount rate and number.
It is worth mentioning that within the counties that do not show high net child undercounts, there may be neighborhoods or communities that did experience high net child undercounts, but those were masked by good child counts in other parts of the county.
The findings provided in this brief aim to contribute to our understanding of the quality of the 2020 Census at a more granular level since state-level measures often mask large differences among counties. Absent more updated information, the information in this study can be used to start targeting outreach and promotion to improve the count of children in the 2030 Census.
This information about where the undercounts of children are the highest in Texas could help the U.S. Census Bureau and Census stakeholders prepare for the 2030 Decennial Census. The data presented in this study is useful to pinpoint the types of places that deserve special attention in the 2030 Census concerning the count of children. This report may serve as a model for other states to understand their net child undercounts.
Finally, researchers could also use these findings as a starting point to examine the characteristics that distinguish counties with high net child undercounts from other counties. Identifying those characteristics may help us reduce net child undercounts in the 2030 Decennial Census by addressing its root causes.
Author’s Message
The net undercount of children (age 0 to 17) in the U.S. Census is high and has been growing in recent decades. This study provides a detailed analysis of high child undercounts at the county level in Texas and explores its regional patterns. These results can serve as a roadmap for deeper analysis.
Census-related data is used to determine the distribution of funding for 350+ federal programs, totaling more than $2.8 trillion each year. Counties with an undercount will not receive the full federal funding they are entitled to, impacting budgets for things like schools, health centers, and childcare centers. Furthermore, counties with an undercount will not have accurate data for future planning.
To address the impact of an undercount, leaders may want to explore ways to compensate counties that experience a high undercount of children. Similarly, leaders in counties with a high undercount of children may want to work with the Census Bureau to look for additional ways to correct the undercount of children in future censuses. The results shown here can be used to start building a targeted approach to increasing the count accuracy of children in the 2030 Census.
Acknowledgements: The authors appreciate the insightful support provided by Helen You, Deborah Stein, and Monica Cruz.
FAQ
1) Why does the U.S. Census Bureau not publish undercounting and overcounting estimates at the county level for children?
As it is well known, the U.S. Census Bureau assesses the quality (undercounting or overcounting) of its Decennial Census using the Post-Enumeration Survey (PES) and the Demographic Analysis (DA).
The PES was implemented in 2020 by characteristics of the housing units only to the national and state levels. The PES uses the location of the housing units to obtain results at the subnational level, but it does not consider demographic characteristics such as age or gender. Moreover, “…the sample size for the 2020 PES and the assumptions required to make unbiased sub-state estimates, the Census Bureau was unable to include county or place estimates in the 2020 PES reports, as well.” (U.S. Census Bureau, 2022).
On the other hand, the Demographic Analysis uses “…current and historical vital records, data on international migration, and Medicare records to produce national estimates of the population on April 1 by age, sex, the DA race categories, and Hispanic origin.” (U.S. Census Bureau, 2022). While the DA is rich in demographic characteristics, it cannot identify the current place of residence of the population since a great part of it is based on vital records. Therefore, due to its nature, the official undercounting or overcounting by demographic characteristics is estimated at the national level only.
Therefore, it is not possible to obtain an official undercounting and overcounting estimate at the county level for children.
2) Why are we using counties as geographies?
This approach implies that undercounting estimation is built upon variables that are considered determinants of undercounting, according to the theory.
3) How accurate or precise are our net child undercount estimates?
While there is no statistical measure of accuracy or precision for our estimates, they were built using official publicly available data from the U.S. Census Bureau.
4) Why are we focusing on counties with high net child undercounts?
Given the potential small random errors in the 2020 Census and the Vintage 2020 Population Estimates, a small difference between them might not necessarily reflect a true net undercount or an overcount. While small net undercounting can be important, our contribution relies on identifying the Texas counties where the net child undercount could be considered a serious problem. By focusing only on counties with high net child undercounts, we are more likely to identify the correct direction of net child undercount.