
Learn How to Engage with Congressional Offices about the Census – Read the Manual Here.
RESEARCH BRIEF | Census Undercount | February 2024 (Updated on June 2024)
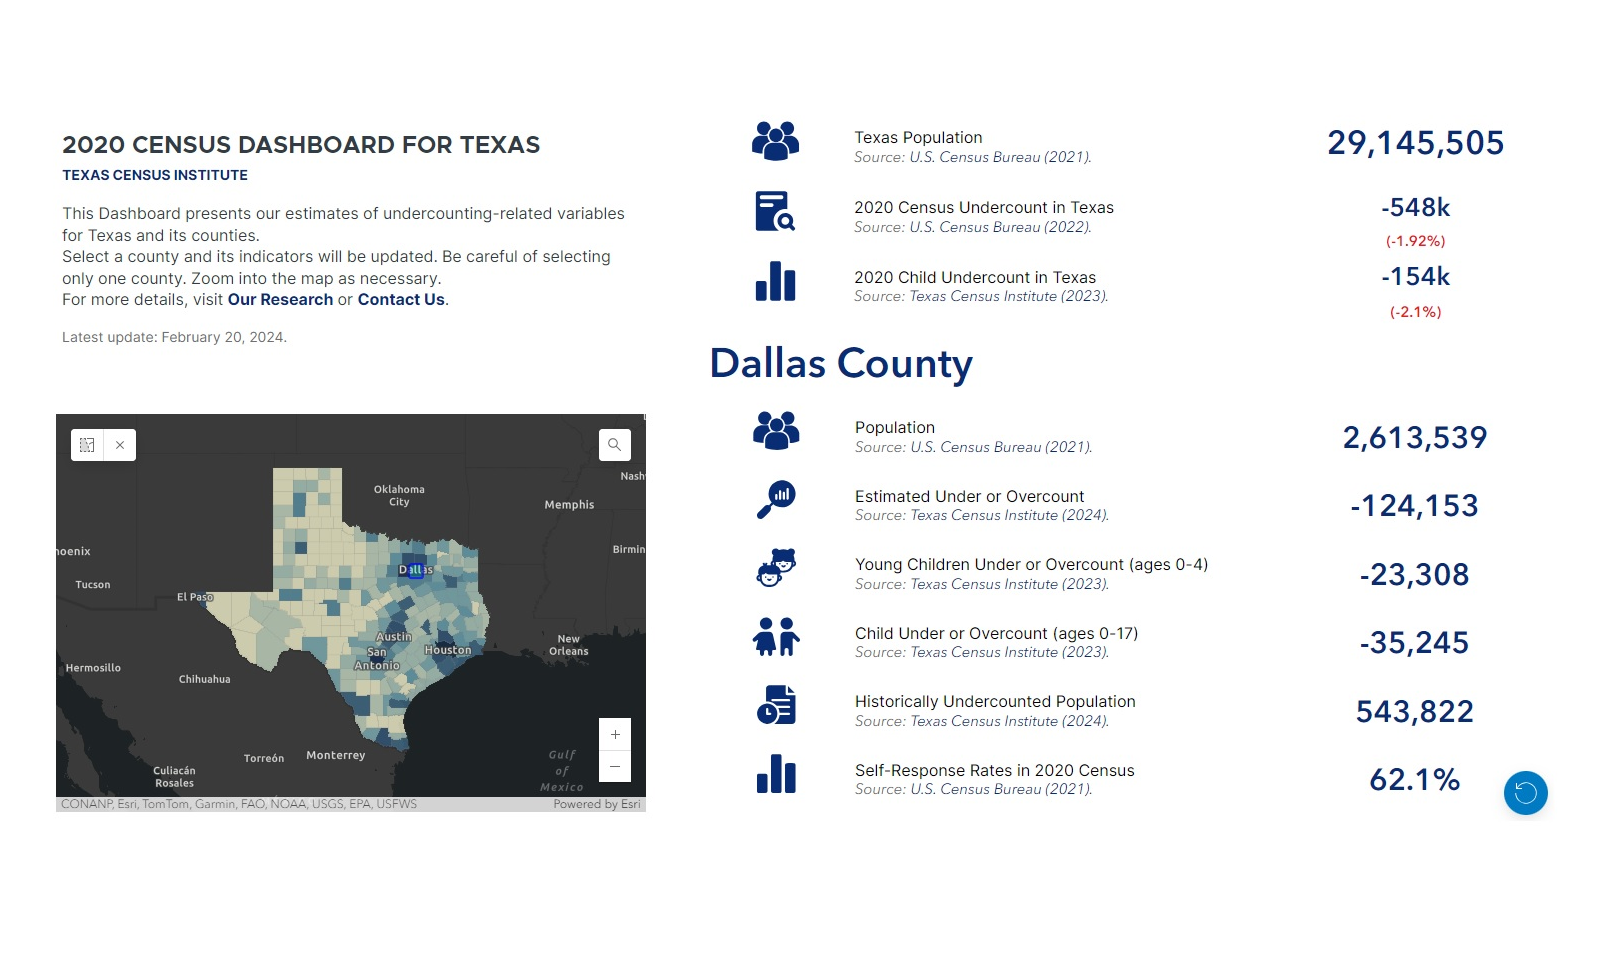
THE 2020 CENSUS UNDERCOUNT IN TEXAS COUNTIES
This research brief estimates the 2020 Census undercount of Texas counties and studies its relationship with census self-response rates.
By: Dr. Francisco A. Castellanos-Sosa, Texas Census Institute, Senior Research Associate
Research Overview
U.S. Census Bureau estimates suggest the 2020 Census undercounted 547,968 Texans. While these state-level numbers are informative, little is known of how this undercount is distributed across its counties. To inform this issue, we estimate the 2020 county-level net undercount in Texas counties and study its spatial distribution using data from the 2020 Census and the Texas Demographic Center 2020 Population Projections. This study aims to build on the work of Eric Jensen and Sandra Johnson and their use of demographic benchmarks to assess the 2020 Census by developing a projections benchmark to assess the 2020 Census at the county level.
Main Findings
177 out of 254 counties (69.7%) in Texas experienced a net undercount of their population.
Harris County, in the Gulf Coast region, experienced the largest numerical net undercount (255,057).
Edwards County, in the South Texas region, experienced the largest net undercount rate (29.4%).
Counties with high undercount rates and numbers are concentrated in the South and West Texas regions.
Most counties with a high numerical and rate net overcount are located in the well-known Texas Triangle.
91.8% of Texas’ net undercount appears in four of twelve Texas regions (Gulf Coast, Alamo, South Texas, and West Texas).
Net undercount is correlated to counties’ self-response rate in the 2020 census.
A 1% increase in the Self-Response Rate is related to a 0.34% lower undercounting.
The relationship between net undercount and the self-response rate is higher in counties with 30k people or less.

Concluding Remarks
This research brief examined disparities between the 2020 Census counts and the Texas Demographic Center’s projections for 2020 as a benchmark to estimate a potential net undercount for Texas counties.
The findings reveal a substantial net undercount in specific Texas counties, particularly in South Texas and West Texas regions, prompting a closer examination of the regional dynamics. Notably, 77.2% of Texas counties exhibit high net undercount (numerical or rate), emphasizing the widespread impact of census discrepancies on diverse communities. Moreover, 91.8% of Texas’ net undercount is found in four regions (Gulf Coast, Alamo, South Texas, and West Texas).
As we navigate through the geographical dispersion of the net undercount in Texas, it becomes evident that Harris County (in the Gulf Coast region) stands out with the most significant negative net undercount, necessitating focused attention on resource distribution and intervention strategies.
The regional analysis further nuances the narrative, showcasing that numerical net undercount must be contextualized with rate variations to understand the issue comprehensively.
In identifying potential drivers of the net undercount when it is positive or negative across counties, we found that a negative net undercount is correlated to counties’ self-response rate in the 2020 census. In particular, a 1% increase in the Self-Response Rate is associated with a 0.34% higher net undercount. In practical terms, this suggests that a 1% increase in the Self-Response Rate is related to a 0.34% lower undercounting. It is critical to point out that, when considering the size of the counties, this relationship is stronger in counties with 30k people or less than in those with 30K+.
In conclusion, this research underscores the urgency of addressing local differences and regional disparities, urging stakeholders, policymakers, and researchers to mitigate these challenges collaboratively. The insights gleaned from this examination contribute to the ongoing discourse on census accuracy and lay the groundwork for targeted interventions and informed decision-making at both the state and regional levels.
Author’s Message
This research is a simple step toward understanding how the undercount at the state level is spread across Texas’ counties. These estimates are constructed using official data sources, ensuring the differences presented here can be further studied concerning their source limitations through the Bureau and TDC methodologies.
The projections benchmark methodology used to distribute net undercounts across counties based on the differences between census counts and TDC Population Projections represents our effort to find innovative ways that allow us to find a more nuanced understanding of population dynamics and census accuracy. This approach not only provides valuable insights but also lays the groundwork for informed decision-making in policy and service planning.
Acknowledgements: The author appreciates the insightful support provided by Helen You, Monica Cruz, and William P. O’Hare.
FAQ
1) Why does the U.S. Census Bureau not publish undercounting and overcounting estimates at the county level?
As it is well known, the U.S. Census Bureau assesses the quality (undercounting or overcounting) of its Decennial Census using the Post-Enumeration Survey (PES) and the Demographic Analysis (DA).
The PES was implemented in 2020 by characteristics of the housing units only to the national and state levels. The PES uses the location of the housing units to obtain results at the subnational level, but it does not consider demographic characteristics such as age or gender. Moreover, “…the sample size for the 2020 PES and the assumptions required to make unbiased sub-state estimates, the Census Bureau was unable to include county or place estimates in the 2020 PES reports, as well.” (U.S. Census Bureau, 2022).
On the other hand, the Demographic Analysis uses “…current and historical vital records, data on international migration, and Medicare records to produce national estimates of the population on April 1 by age, sex, the DA race categories, and Hispanic origin.” (U.S. Census Bureau, 2022). While the DA is rich in demographic characteristics, it cannot identify the current place of residence of the population since a great part of it is based on vital records. Therefore, due to its nature, the official undercounting or overcounting by demographic characteristics is estimated at the national level only.
Therefore, it is not possible to obtain an official undercounting and overcounting estimate at the county level.
2) Why are we using counties as geographies?
Counties are used here as the geographical level of study because they are political subdivisions small enough to capture within-state disparities, and large enough to group social representation.
3) How accurate or precise are our net undercount estimates?
While there is no statistical measure of accuracy or precision for our estimates, they were built using official publicly available data from the U.S. Census Bureau and the Texas Demographic Center.
4) Why does the TDC produce population projections?
The State of Texas mandates the production of population annual estimates and biennial projections by its demography center, the TDC. In addition to the State’s use of TDC Population Projections data, cities and counties use population projections to plan and forecast public services. Because the TDC supplies data to all State bodies and elected officials, Projections are broken down to the county level, making it a helpful resource, which allows TxCI to approximate the population gaps found by the PES at substate geographic levels. You can find more details of the TDC Population Projections here.
5) Why does TxCI use TDC Population Projections to calculate the census undercount at the county level?
“…the Census Bureau was unable to include county or place estimates in the 2020 PES reports….” (U.S. Census Bureau, 2022). For this reason, we compare the 2020 Census’ county-level population counts with what we consider are the second-best population figures at the county level: the TDC Population Projections.
6) How does this approach relate to previous research published by TxCI?
Until now, TxCI relied upon the assumption that all counties faced an undercount and that counties’ undercounts would be within the undercount range provided by the U.S. Census Bureau for Texas. While well-sourced, this seemed hard to verify given the striking variances in population density and characteristics across Texas.
TxCI’s new study distributes the net undercount provided by the Bureau across counties using the most accurate population number available after the 2020 Census counts: the 2020 TDC Population Projections.. The 2018 version of the TDC Population Projection suggests Texas’ population would be 1.82% above the 2020 Census counts, a number strikingly similar to the -1.92% net coverage error ultimately published by the U.S. Census Bureau.
In this analysis, we consider the differences between the 2020 Census and the TDC Population Projections as an alternative way to observe the potential “true” value of the population at the county level. And adjust the county-level figures such that the differences between the 2020 Census and TDC Population Projections add up to the -1.92% of the U.S. Census Bureau.