
Learn How to Engage with Congressional Offices about the Census – Read the Manual Here.
RESEARCH BRIEF | Census Undercount | February 2024 (Updated on June 2024)
THE 2020 CENSUS UNDERCOUNT IN TEXAS COUNTIES
This research brief estimates the 2020 Census undercount of Texas counties and studies its relationship with census self-response rates.
By: Dr. Francisco A. Castellanos-Sosa, Texas Census Institute, Senior Research Associate
Research Overview
U.S. Census Bureau estimates suggest the 2020 Census undercounted 547,968 Texans. While these state-level numbers are informative, little is known of how this undercount is distributed across its counties. To inform this issue, we estimate the 2020 county-level net undercount in Texas counties and study its spatial distribution using data from the 2020 Census and the Texas Demographic Center 2020 Population Projections. This study aims to build on the work of Eric Jensen and Sandra Johnson and their use of demographic benchmarks to assess the 2020 Census by developing a projections benchmark to assess the 2020 Census at the county level.
Main Findings
177 out of 254 counties (69.7%) in Texas experienced a net undercount of their population.
Harris County, in the Gulf Coast region, experienced the largest numerical net undercount (255,057).
Edwards County, in the South Texas region, experienced the largest net undercount rate (29.4%).
Counties with high undercount rates and numbers are concentrated in the South and West Texas regions.
Most counties with a high numerical and rate net overcount are located in the well-known Texas Triangle.
91.8% of Texas’ net undercount appears in four of twelve Texas regions (Gulf Coast, Alamo, South Texas, and West Texas)
Net undercount is correlated to counties’ self-response rate in the 2020 census.
A 1% increase in the Self-Response Rate is related to a 0.34% lower undercounting.
The relationship between net undercount and the self-response rate is higher in counties with 30k people or less.
Figure 1.b
Net undercount rate in Texas counties.
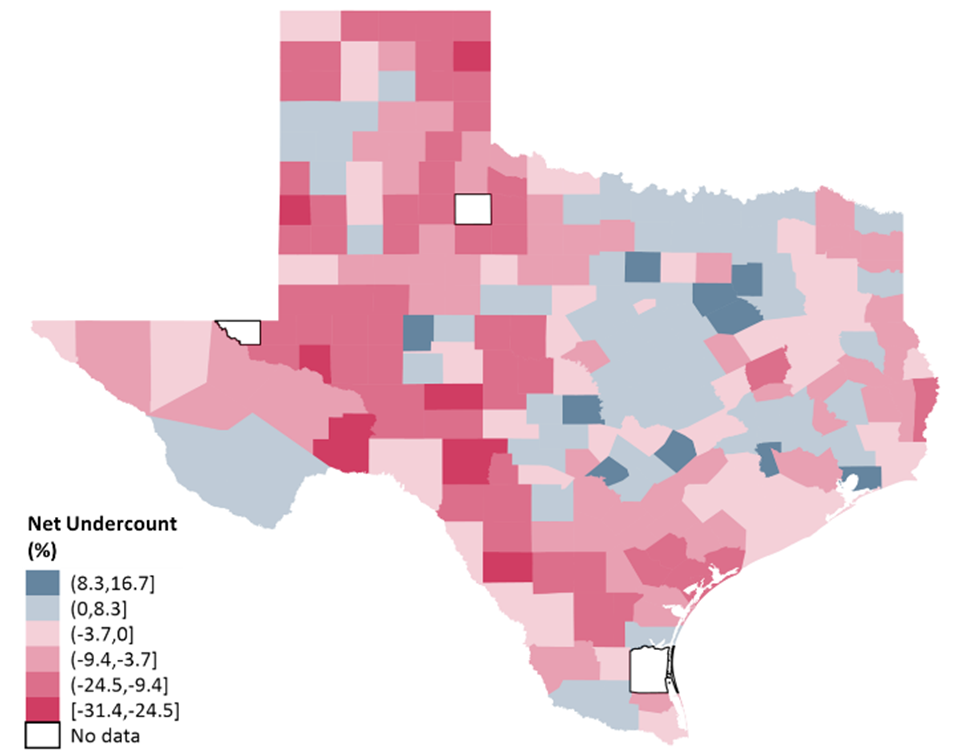
Note: A darker red color indicates a higher negative net undercount. A darker blue color indicates a higher positive net undercount (or net overcount). Loving, Kenedy, and King are excluded from the analysis due to the differential privacy approach used to estimate their populations.
Introduction
An accurate census in the U.S. is paramount as census data serve as the foundation for informed decision-making across various sectors. The Census provides a comprehensive and up-to-date population demographic profile, offering crucial insights into the distribution, composition, and characteristics of communities. These data are instrumental in shaping public policies, allocating government resources, and ensuring fair political representation by apportioning congressional seats. The Project On Government Oversight (POGO) recently found that census-derived data were instrumental in distributing $150.3 billion to Texas in Fiscal Year 2020.1 Overall, a reliable census is the cornerstone of a well-informed and equitable society.
After 2020 Census data collection was complete, the U.S. Census Bureau (Bureau) performed a Post-Enumeration Survey (PES) to assess the quality of the 2020 Decennial Census.2 It concluded that six states, including Texas, experienced an undercount in the 2020 Census. The PES suggests the 2020 Census missed 547,968 people (1.92% of its 28,540,000-household population). According to the PES, the Texas population should have been 29,693,473 rather than the 29,145,505 recorded from the 2020 Census.
The undercount of Texas is the second-largest numerical undercount during the 2020 Census, and Texas is the second-largest state in terms of its population. On top of that, Texas is the state with the most counties: 254. However, there is no official information about total population undercounts at the county level, as PES’ results “…are not broken down by demographic characteristics or geographic areas within the state given the sample size for the PES and the assumptions required to make substate geographic estimates”.2
Despite the undercount seen in the 2020 Census, the Census count remains the most accurate source of total population for U.S. geographies. To increase our understanding of the undercount at the county level, the Texas Census Institute (TxCI) uses the counties’ population projections from the Texas Demographic Center (TDC) as a source of secondary information on how the population might be distributed across the 254 Texas counties. Our study distributes Texas statewide undercount of 547,968 people across its counties using the TDC projections as a benchmark. This approach builds on the work of Eric Jensen and Sandra Johnson from the U.S. Census Bureau, and their use of demographic benchmarks to assess the 2020 Census.3
Jensen and Johnson’s approach is most accurately performed for children and young children since those populations are typically counted by birth registration data, which is considered highly accurate.4–9 A similar approach is not appropriate for the entire population since people born in one place often move to another during their lifetime. The closest approach to the demographic benchmark, in our opinion, is to use a county-level population estimate or projection that considers multiple different population gain and loss patterns across age groups and demographic categories.
In 2018, The Texas Demographic Center’s projection for the Texas population in 2020 was 29,677,668 (just 0.05% below the 29,693,473 estimated by the PES). This close correlation between counting efforts suggests our projection benchmark approach works within an accepted range of reliability. Since the TDC projection is broken down to the county level, it is an important resource to approximate undercounting at a county level. We use the Texas Demographic Center’s projection for the 2020 Texas population released in 2018 as TDC’s projections are estimated every two years in non-census years, and the 2018 version is the one that occurred closest to the 2020 Census and contains most of the updated data used to generate it.
Building on the differences between census counts and TDC projections, we strive to identify the potential undercount at the county level, understand why the differences exist, and support initiatives that can improve the accuracy of the population count in Texas, either through improving self-response, advocating for measures that will remove structural barriers to an accurate count (such as the Participant Statistical Areas Program (PSAP), the Local Update of Census Addresses (LUCA), among other initiatives), or raising awareness around the importance of a complete count. Having the data disaggregated in this way will enable stakeholders to address localized challenges effectively, identify disparities, and implement interventions catering to diverse community needs.
Data
This brief uses TDC’s Projections of Texas counties’ population and the U.S. Census Counts.10,11
To keep county-level data accuracy within a high-quality standard, we do not study counties with data that could have been compromised by the 2020 Census’ new differential privacy approach, which is designed to protect respondent’s identity in compliance with Title 13 and Title 26. For instance, for the 2010 Census, studies suggest that this new privacy protection came at the expense of data accuracy, and some counties experienced a high loss of data accuracy.12 For instance, Loving County, the county with the smallest population in Texas, had a 17.1% difference due to differential privacy when comparing the 2010 Census count and the new Disclosure Avoidance System (DAS) used in the 2020 Census. This phenomenon also occurred with the next two smallest counties, King and Kennedy County, with a 5.2% and 4.6% difference. We excluded these counties from our study to avoid inaccuracies related to DAS. For reference, their combined population represents 0.002% of Texas’ population and reduces the sample to 251 counties.
Methodology
The Census count remains the most accurate source of total population for U.S. geographies. To approximate the undercount or overcount at the county level in Texas, we ‘spread’ the 547,968-people undercount obtained by the Post-Enumeration Survey across its counties.
To geographically distribute the official undercount of Texas, we use an adjusted difference between the Census count and the TDC projections as weights to disperse the official state measure across counties.
In doing so, we first estimate the difference between the 2020 Census count and the TDC projections. TDC projections are subtracted from census counts to determine whether the difference is positive or negative. A negative value indicates net undercount, and a positive value indicates net overcount. The sum of the differences is -532,163. So, we adjust counties’ differences by 1.0296996 (the ratio between -547,968 and -532,163) to make counties’ differences add up to the PES’ Net Coverage Error. We then estimate the share these differences represent from the TDC Projections to estimate undercount rates. We acknowledge that this method is different from the procedure performed by the U.S. Census Bureau when estimating net coverage errors (the PES); however, it allows us to identify the potential undercount at the county level. The similarities in outcomes give us confidence in the reliability of our numerical and rate undercount for Texas counties.
Giving special attention to counties with high undercounts and overcounts allows us to identify counties with a meaningful undercount or overcount. We classify counties’ differences as high or low based on four thresholds: undercount rate above 5.0% or below -5.0% and numerical undercount above 500 or below -500 people. This approach has become a standard in other research studies comparing census counts to other benchmarks.3,8,9,13 Given the potential small random errors in the 2020 Census and the TDC projections, a small value between them might not necessarily reflect a meaningful or true undercount or overcount. Our contribution relies on identifying the potential undercounts and overcounts for Texas counties regardless of its size.
The lowest values of the census self-response rate have been associated with net undercount by the U.S. Census Bureau.14 In particular, the Bureau found a statistically significant net undercount for people living in the 20% of census tracts with the lowest self-response rates. A recent study by the National Academies of Sciences reinforced this finding, suggesting that “…[2020 Census] quality deteriorates the lower the self-response rate”.15
Finally, we conclude our analysis by examining the relationship between the Texas counties’ net undercount rate and their Census self-response rate.
To do this, it is important to clarify the interpretation of net undercount in regard to its sign. A net undercount is associated with an undercount since the population is not being counted in net terms. On the other hand, a positive net undercount is associated with overcounting because more people are being considered in the counting. Therefore, when exploring the relationship between the county-level net undercount rate with their self-response rate, it is important to separate counties into two subsamples: those with a negative and those with a positive net undercount rate.
Special Considerations
In addition to reporting the differences between the 2020 Census and the TDC Projections, the projection benchmark approach used here might also reflect the net coverage error and inaccuracies on the base population and births, deaths, and migrant rates used by the TDC when estimating their projections. Similarly, the differences here presented as net undercount figures might contain part of the noise injected by the 2020 census new differential.12
Results
Counties Undercount
Most Texas counties experienced a TDC projection higher than their Census count (177 out of 254, or 69.7% of counties) (see Figure 1). The other 74 Texas counties (29.1%) observed a TDC projection lower than their Census count.
Interestingly, in terms of numerical net undercount, counties with a positive net undercount observed a maximum value of up to 25,841 people (in Collin County, located in the Metroplex Region, which represented 2.5% of its TDC projection). Counties with a negative net undercount (TDC projection higher than a Census count) observed the largest negative net undercount of -255,057 (in Harris County, located in the Gulf Coast region, representing -5.1% of its TDC projection).
In terms of rates, counties with a positive net undercount (or net overcount) observed a maximum rate of 16.6% (in Kaufman County, located in the Metroplex Region, equivalent to 20,775 people). However, counties with a negative net undercount observed the largest negative rate of -29.4% (in Edwards County, located in the South Texas region, which is equivalent to -586 people).

These initial results showed that counties with a small population could easily have a high-rate undercount and a low numerical net undercount because a number would represent a higher share than in a more populated county. Therefore, it is important to distinguish the distribution of the counties by low and high net undercount for the cases in which the net undercount is positive or negative (see Table 1).

Our analysis sorts counties into eight groups to observe the combination of low and high rates and numbers between the counties that observed a net undercount and those that observed a net overcount: four groups for net undercounts and four groups for net overcounts. From this point forward, for simplicity purposes, we will refer to “positive net undercount” as an “overcount”, and to “negative net undercount” as an “undercount”.
In Texas, 196 out of 254 counties (77.2%) have either a High Rate or a High Number, or both (instinctively of the sign of the net undercount). This suggests that most Texas counties have at least one type of high net undercount (colored counties in Figure 2).
Of these 196 counties, 97 have a combination of high and low numbers and rates (high rate and low number, or low number and high rate) regardless of whether the net undercount is positive or negative (see light red and light blue counties in Figure 2). These 97 counties have a negative net undercount (after balancing out the negative and positive net undercount of counties) of -220,527 people (40.3% of the PES net undercount of -547,968 people).
Among the other 99 counties having a high net undercount (rate and numerical), independently of the sign of the net undercount (see Figure 3), 81 counties have a negative net undercount, and 18 have a net overcount. These 99 counties have a net undercount of -326,138 people (59.5% of the PES net undercount of 547,968 people).
Counties with a high net undercount (numerical and rate) predominate in the South Texas and West Texas regions. On the other side, most counties with a high numerical and rate positive net undercount (or net overcount) are close to the well-known Texas Triangle, composed of Texas’ biggest metropolitan areas (Houston, Dallas, San Antonio, and Austin).


Net Undercount and Self-Response Rate
We find that the net undercount rate and the self-response rate of Texas counties have a statistically significant correlation of 0.53 at the 1% confidence level (see green dashed line in Figure 4). However, the relationship is also presented separately for counties with an undercount (in red) and those with an overcount (in blue) since both situations might originate from different reasons. We find that negative values of net undercount are correlated to counties’ self-response rates in the 2020 census, presenting a statistically significant correlation of 0.49 at the 1% confidence level. On the other hand, counties with a positive net undercount (or net overcount) do not have a statistical correlation between these variables.
Three facts jump out at first glance from Figure 4: most Texas counties are small, highly populated counties (big circles) are located at the right part of the graph (with higher 2020 Census Self-Response Rates), and there is a clear relationship between net undercount and Census Self-Response Rates (the lowest the Self-Response Rate, the largest the undercount).
The blue circles (or those above the horizontal axis) are counties with a positive net undercount. Counties represented by red circles (or those below the horizontal axis) have a negative net undercount. Straight lines are fitted values from a linear regression between the variables for each subsample. The almost null slope of the blue straight line suggests the net undercount is mainly steady, regardless of the self-response rate of the counties. The steeper slope of the red straight line suggests a positive correlation between the variables for counties with a negative net undercount.

This result provides evidence in favor of the existing literature that suggests the quality of the Census is worse at lower self-response rates.14,15 A 1% increase in the self-response rate is associated with a 0.34% higher net undercount. In other words, a 1% increase in the self-response rate is related to a 0.34% lower undercounting.
The population of Texas is scattered across its geography: 160 of its 254 counties have 30,000 or fewer people. We performed a robustness check for counties with 30K or fewer people and counties with 30K+ people and found that the magnitude of the correlation is relatively higher in the less populated counties. A 1% increase in the self-response rate is associated with a 0.30% higher net undercount in counties with 30K people or less, while it is associated with a 0.17% higher net undercount in 30K+ counties.
Concluding Remarks
This research brief examined disparities between the 2020 Census counts and the Texas Demographic Center’s projections for 2020 as a benchmark to estimate a potential net undercount for Texas counties.
The findings reveal a substantial net undercount in specific Texas counties, particularly in South Texas and West Texas regions, prompting a closer examination of the regional dynamics. Notably, 77.2% of Texas counties exhibit high net undercount (numerical or rate), emphasizing the widespread impact of census discrepancies on diverse communities. Moreover, 91.8% of Texas’ net undercount is found in four regions (Gulf Coast, Alamo, South Texas, and West Texas).
As we navigate through the geographical dispersion of the net undercount in Texas, it becomes evident that Harris County (in the Gulf Coast region) stands out with the most significant negative net undercount, necessitating focused attention on resource distribution and intervention strategies.
The regional analysis further nuances the narrative, showcasing that numerical net undercount must be contextualized with rate variations to understand the issue comprehensively.
In identifying potential drivers of the net undercount when it is positive or negative across counties, we found that a negative net undercount is correlated to counties’ self-response rate in the 2020 census. In particular, a 1% increase in the Self-Response Rate is associated with a 0.34% higher net undercount. In practical terms, this suggests that a 1% increase in the Self-Response Rate is related to a 0.34% lower undercounting. It is critical to point out that, when considering the size of the counties, this relationship is stronger in counties with 30k people or less than in those with 30K+.
In conclusion, this research underscores the urgency of addressing local differences and regional disparities, urging stakeholders, policymakers, and researchers to mitigate these challenges collaboratively. The insights gleaned from this examination contribute to the ongoing discourse on census accuracy and lay the groundwork for targeted interventions and informed decision-making at both the state and regional levels.
References
- Project on Government Oversight. Dollars and Demographics: How Census Data Shapes Federal Funding Distribution. (2023).
- U.S. Census Bureau. 2020 Census Post-Enumeration Survey Results Available for 50 States and DC in May. (2022).
- Jensen, E. B. & Johnson, S. L. Using Demographic Benchmarks to Help Evaluate 2020 Census Results. United States Census Bureau. Random Samplings https://www.census.gov/newsroom/blogs/random-samplings/2021/11/demographic-benchmarks-2020-census.html (2021).
- O’Hare, W. P. County-level Coverage Rates of Young Children in the 2020 Census: The National-Level Data Do Not Tell the Full Story. https://countallkids.org/resources/county-level-coverage-rates-of-young-children-in-the-2020-census-the-national-level-data-do-not-tell-the-full-story/ (2023).
- O’Hare, W. P. State Undercount Rates for Young Children in the 2020 Census. https://countallkids.org/resources/state-undercount-rates-for-young-children-in-the-2020-census/ (2023).
- O’Hare, W. P., Robinson, J. G., West, K. & Mule, T. Comparing the U.S. Decennial Census Coverage Estimates for Children from Demographic Analysis and Coverage Measurement Surveys. Popul. Res. Policy Rev. 35, 685–704 (2016).
- Castellanos-Sosa, F. A. & O’Hare, W. P. The 2020 Census Undercount of Children in Texas Counties. (2023).
- Castellanos-Sosa, F. A. & O’Hare, W. P. The 2020 Census Undercount of Young Children in Texas Counties. (2023).
- Castellanos-Sosa, F. A. & O’Hare, W. P. Texas Counties with High Child Undercounts in the 2020 U.S. Census. (2023).
- Texas Demographic Center. Projections of the Population of Texas and Counties in Texas by Age, Sex, and Race/Ethnicity for 2010-2050. https://demographics.texas.gov/Resources/TPEPP/Projections/2018/Methodology.pdf (2018).
- U.S. Census Bureau. 2020 Census: Redistricting File (Public Law 94-171) Dataset. https://www.census.gov/data/datasets/2020/dec/2020-census-redistricting-summary-file-dataset.html (2021).
- Texas Demographic Center. Evaluating the Impact of Differential Privacy Using the Census Bureau’s 2010 Demonstration Data Products Released on June 8, 2021. https://demographics.texas.gov/Resources/Publications/2021/20210526_DiffPrivacyInfo.pdf (2021).
- O’Hare, W. P. Counties with High Undercounts of Children in 2020 U.S. Census. https://2hj858.a2cdn1.secureserver.net/wp-content/uploads/2023/03/Counties-with-High-Undercounts-of-Children-in-2020-U.S.-Census.pdf (2023).
- Hill, C., Heim, K., Hong, J. & Phan, N. Census Coverage Estimates for People in the United States by State and Census Operations. https://www2.census.gov/programs-surveys/decennial/coverage-measurement/pes/census-coverage-estimates-for-people-in-the-united-states-by-state-and-census-operations.pdf (2022).
- National Academies of Sciences, Engineering, and M. Understanding the Quality of the 2020 Census: Interim Report. (The National Academies Press, 2022). doi:10.17226/26529.
Author’s Message
This research is a simple step toward understanding how the undercount at the state level is spread across Texas’ counties. These estimates are constructed using official data sources, ensuring the differences presented here can be further studied concerning their source limitations through the Bureau and TDC methodologies.
The projections benchmark methodology used to distribute net undercounts across counties based on the differences between census counts and TDC Population Projections represents our effort to find innovative ways that allow us to find a more nuanced understanding of population dynamics and census accuracy. This approach not only provides valuable insights but also lays the groundwork for informed decision-making in policy and service planning.
Acknowledgements: The author appreciates the insightful support provided by Helen You, Monica Cruz, and William P. O’Hare.
FAQ
1) Why does the U.S. Census Bureau not publish undercounting and overcounting estimates at the county level?
As it is well known, the U.S. Census Bureau assesses the quality (undercounting or overcounting) of its Decennial Census using the Post-Enumeration Survey (PES) and the Demographic Analysis (DA).
The PES was implemented in 2020 by characteristics of the housing units only to the national and state levels. The PES uses the location of the housing units to obtain results at the subnational level, but it does not consider demographic characteristics such as age or gender. Moreover, “…the sample size for the 2020 PES and the assumptions required to make unbiased sub-state estimates, the Census Bureau was unable to include county or place estimates in the 2020 PES reports, as well.” (U.S. Census Bureau, 2022).
On the other hand, the Demographic Analysis uses “…current and historical vital records, data on international migration, and Medicare records to produce national estimates of the population on April 1 by age, sex, the DA race categories, and Hispanic origin.” (U.S. Census Bureau, 2022). While the DA is rich in demographic characteristics, it cannot identify the current place of residence of the population since a great part of it is based on vital records. Therefore, due to its nature, the official undercounting or overcounting by demographic characteristics is estimated at the national level only.
Therefore, it is not possible to obtain an official undercounting and overcounting estimate at the county level.
2) Why are we using counties as geographies?
Counties are used here as the geographical level of study because they are political subdivisions small enough to capture within-state disparities, and large enough to group social representation.
3) How accurate or precise are our net undercount estimates?
While there is no statistical measure of accuracy or precision for our estimates, they were built using official publicly available data from the U.S. Census Bureau and the Texas Demographic Center.
4) Why does the TDC produce population projections?
The State of Texas mandates the production of population annual estimates and biennial projections by its demography center, the TDC. In addition to the State’s use of TDC Population Projections data, cities and counties use population projections to plan and forecast public services. Because the TDC supplies data to all State bodies and elected officials, Projections are broken down to the county level, making it a helpful resource, which allows TxCI to approximate the population gaps found by the PES at substate geographic levels. You can find more details of the TDC Population Projections here.
5) Why does TxCI use TDC Population Projections to calculate the census undercount at the county level?
“…the Census Bureau was unable to include county or place estimates in the 2020 PES reports….” (U.S. Census Bureau, 2022). For this reason, we compare the 2020 Census’ county-level population counts with what we consider are the second-best population figures at the county level: the TDC Population Projections.
6) How does this approach relate to previous research published by TxCI?
Until now, TxCI relied upon the assumption that all counties faced an undercount and that counties’ undercounts would be within the undercount range provided by the U.S. Census Bureau for Texas. While well-sourced, this seemed hard to verify given the striking variances in population density and characteristics across Texas.
TxCI’s new study distributes the net undercount provided by the Bureau across counties using the most accurate population number available after the 2020 Census counts: the 2020 TDC Population Projections.. The 2018 version of the TDC Population Projection suggests Texas’ population would be 1.82% above the 2020 Census counts, a number strikingly similar to the -1.92% net coverage error ultimately published by the U.S. Census Bureau.
In this analysis, we consider the differences between the 2020 Census and the TDC Population Projections as an alternative way to observe the potential “true” value of the population at the county level. And adjust the county-level figures such that the differences between the 2020 Census and TDC Population Projections add up to the -1.92% of the U.S. Census Bureau.