
Learn How to Engage with Congressional Offices about the Census – Read the Manual Here.
RESEARCH REPORT | December 2022
UNDERCOUNTING AND OVERCOUNTING POPULATION IN TEXAS COUNTIES
A methodology for estimating the undercount in Texas at the county level.
By: Francisco A Castellanos Sosa, The University of Texas at Austin
Research Overview
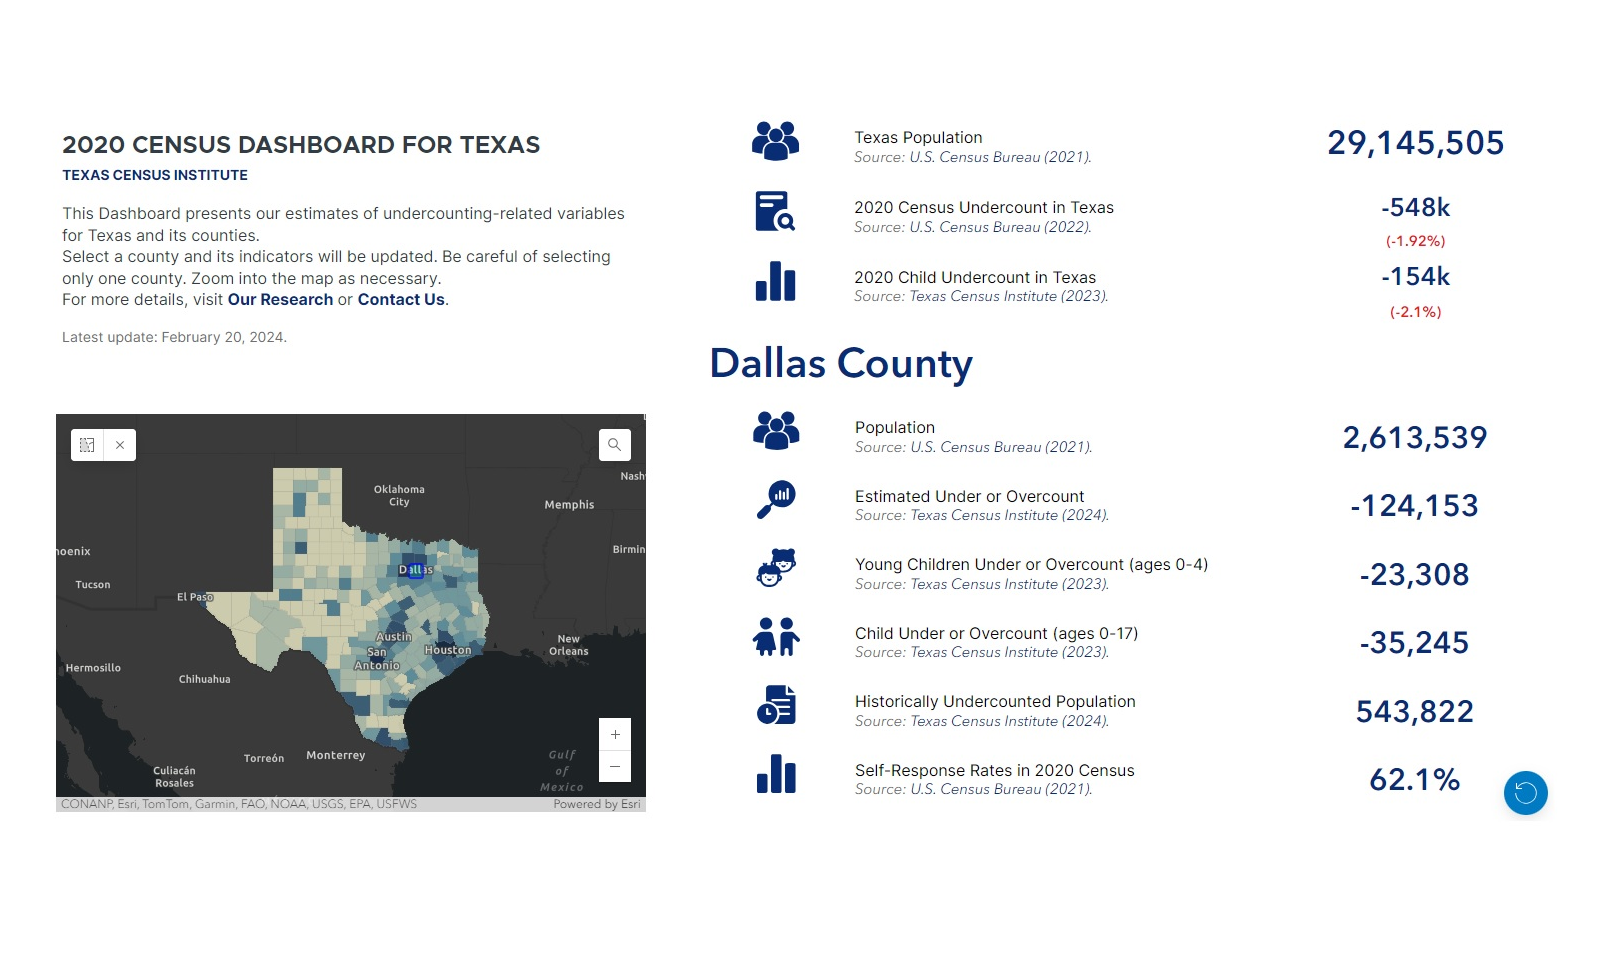
During the 2020 Decennial Census, the U.S. Census Bureau estimates they undercounted the population in six states and overcounted in eight but offers no data at the sub-state or county level. Texas is one of the states with an estimated undercount, calculated at 1.9%. To gain a localized understanding of where there was an undercount in Texas, the Texas Census Institute presents a methodology to estimate undercounting by studying what theoretical factors contributed to it. Our exploration of social capital, geography, and other factors offer potential explanations as to why certain counties experienced less participation in census activities.
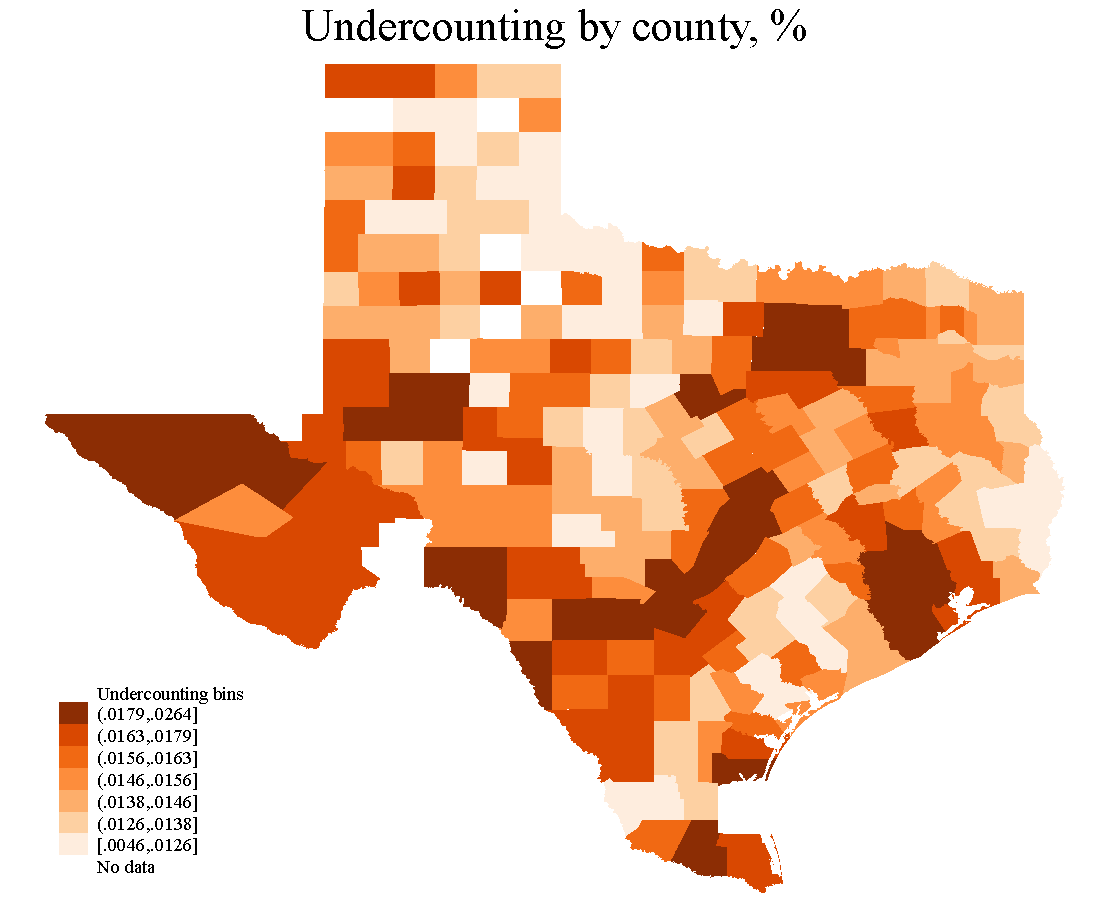
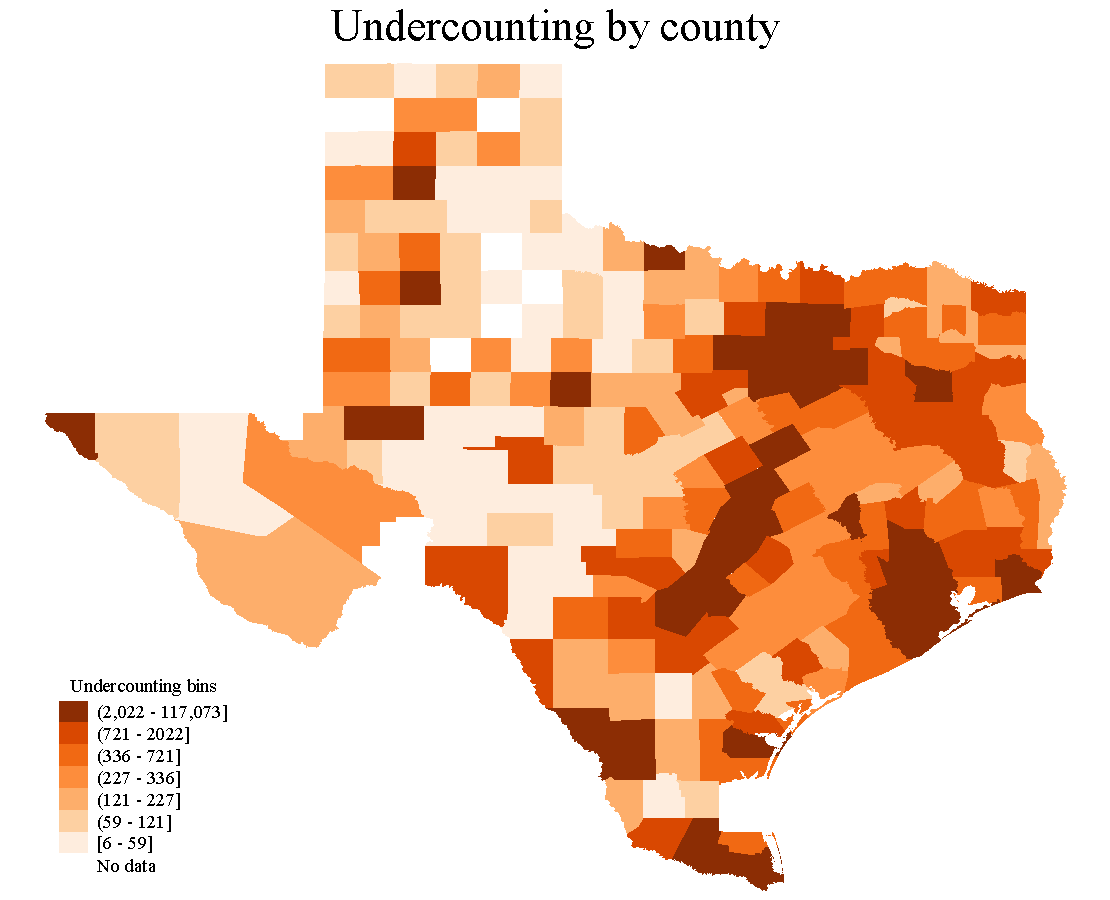
Geographical dispersion of the undercounting share and undercounting in Texas.
Key Findings
Undercounting is theoretically associated with personal, geographical, and census features dimensions.
Undercounting is primarily present in Texas’ metropolitan areas and main counties along the U.S.-Mexico border.
There is a positive correlation between undercounting and the share of the population in the main working-age groups of 15-19, 20-24, 25-34, and 35-44.
There is a positive correlation between undercounting and the share of the population for Asian and Hispanic races, groups that are traditionally recognized with higher levels of immigration.
Census self-response rate using the Internet is related to more undercounting.
Census self-response rate using traditional methods such as phone and mail is related to less undercounting.
Pros
This methodology offers a practical approach to estimating undercounting and overcounting at a sub-state level.
The data required for this methodology is publicly available and independently verified.
Our approach is a statistically conservative measure since it uses the state-level undercounting 90% confidence interval provided by the U.S. Census Bureau.
Cons
This theoretical methodology may not fully capture the whole set of factors faced by Texans today.
The social capital and social exchange variables used in our methodology come from a recent academic publication, which may or may not be updated in upcoming years.
Counties within Texas might differ in many aspects, and be located out of the 90% confidence interval of the state-level undercounting and overcounting estimates provided by the U.S. Census Bureau.
Authors Message
To the extent that counties might present undercounting and overcounting approximations, their estimates might be different due to unobservable reasons. However, even in these circumstances, our undercounting and overcounting approximations aim to be a sufficient guide for intervention. The general goal of our methodology is to provide a data-driven exploration of what Texans are counted or not and to pursue ideas for creating an equitable census.
Acknowledgements: The authors appreciate the insightful support provided by Dr. Lloyd B. Potter, Dr. Monica Cruz, Dr. Mary Campbell, and Dr. Shannon Cavanagh.
FAQ
1) Why does the U.S. Census Bureau not publish undercounting and overcounting estimates at the county level?
The official answer is that “Given the sample size for the 2020 [Post-Enumeration Survey] (PES) and the assumptions required to make unbiased sub-state estimates, the Census Bureau was unable to include county or place estimates in the 2020 PES reports, as well.” (U.S. Census Bureau, 2022) .
2) What does a “Determinants-Side Approach” mean in this context?
This approach implies that undercounting estimation is built upon variables that are considered determinants of undercounting, according to the theory.
3) How accurate or precise are our undercounting estimates?
There is no statistical measure of accuracy or precision for our estimates. However, they are considered conservative measures since they allow the counties to have an undercounting share within the 90% confidence level interval of the state-level undercounting.
4) Why are we considering individual, geographical, and census features as criteria for calculating the undercount?
We recognize that undercounting might arise from basic elements of counting population: each person itself, its natural environment, and the mechanism used to count. Therefore, parsimony makes it straightforward to identify undercounting determinants coming from each of these criteria.
5) Why do we not use variables associated with demographic characteristics?
We have not found theoretical evidence that any demographic characteristic is a singular determinant of undercounting. While some specific population groups are believed to be undercounted, it is not due to their demographic characteristics alone, but more accurately attributed to their individual, geographical and census features.