
Learn How to Engage with Congressional Offices about the Census – Read the Manual Here.
RESEARCH BRIEF | Children | August 2023
The 2020 Census Undercount of Children in Texas Counties
In partnership with Dr. Bill O’Hare from Count All Kids, this research brief estimates the undercount of Texas children by county in the 2020 Census.
By: Dr. Francisco A. Castellanos-SosaA, Texas Census Institute, Senior Research Associate
Dr. William P. O’Hare, Count All Kids Campaign, Consultant
The Children’s Census Initiative
The Texas Census Institute created the Children’s Census Initiative to improve the accuracy with which the 2030 Census will count Texas children. The initiative comprises five related parts, each tackling a specific aspect of this phenomenon to enable a thorough analysis and informed decision-making. This research brief is the first product of the initiative, and its objective is to serve as a descriptive overview of child undercounts in the state by providing an innovative measurement of children’s undercount in Texas counties and regions. The following four topics are part of this initiative and will study 1) the counties with high net child undercount in Texas, 2) the determinants of Texas child undercount, 3) its economic impact, and 4) its short-and long-term implications. Collectively, this initiative will offer valuable insights and recommendations for addressing the U.S. Census child undercount and empowering stakeholders with the knowledge for effective decision-making and action.
Research Overview
There was a substantial undercount of children in the 2020 U.S. Census and particularly in Texas. Based on the U.S. Census Bureau’s Demographic Analysis, the net undercount of children in the U.S. Census increased from 1.7% in 2010 to 2.1% in 2020. The net undercount of children contrasts with a 0.2% overcount for adults. While these national numbers are informative, state and local data from the decennial census is critical to gain a constructive understanding of the issue. However, little is known about undercounting children at the county level. To inform this issue, we estimated the Texas net child undercount at the county level and studied its spatial distribution using data from the 2020 Census and the Vintage 2020 population estimates. This study builds on the work of Dr. William P. O’Hare, who finds Texas had more counties with high net undercounts of children than any other state (either in number or rate terms).
Main Findings
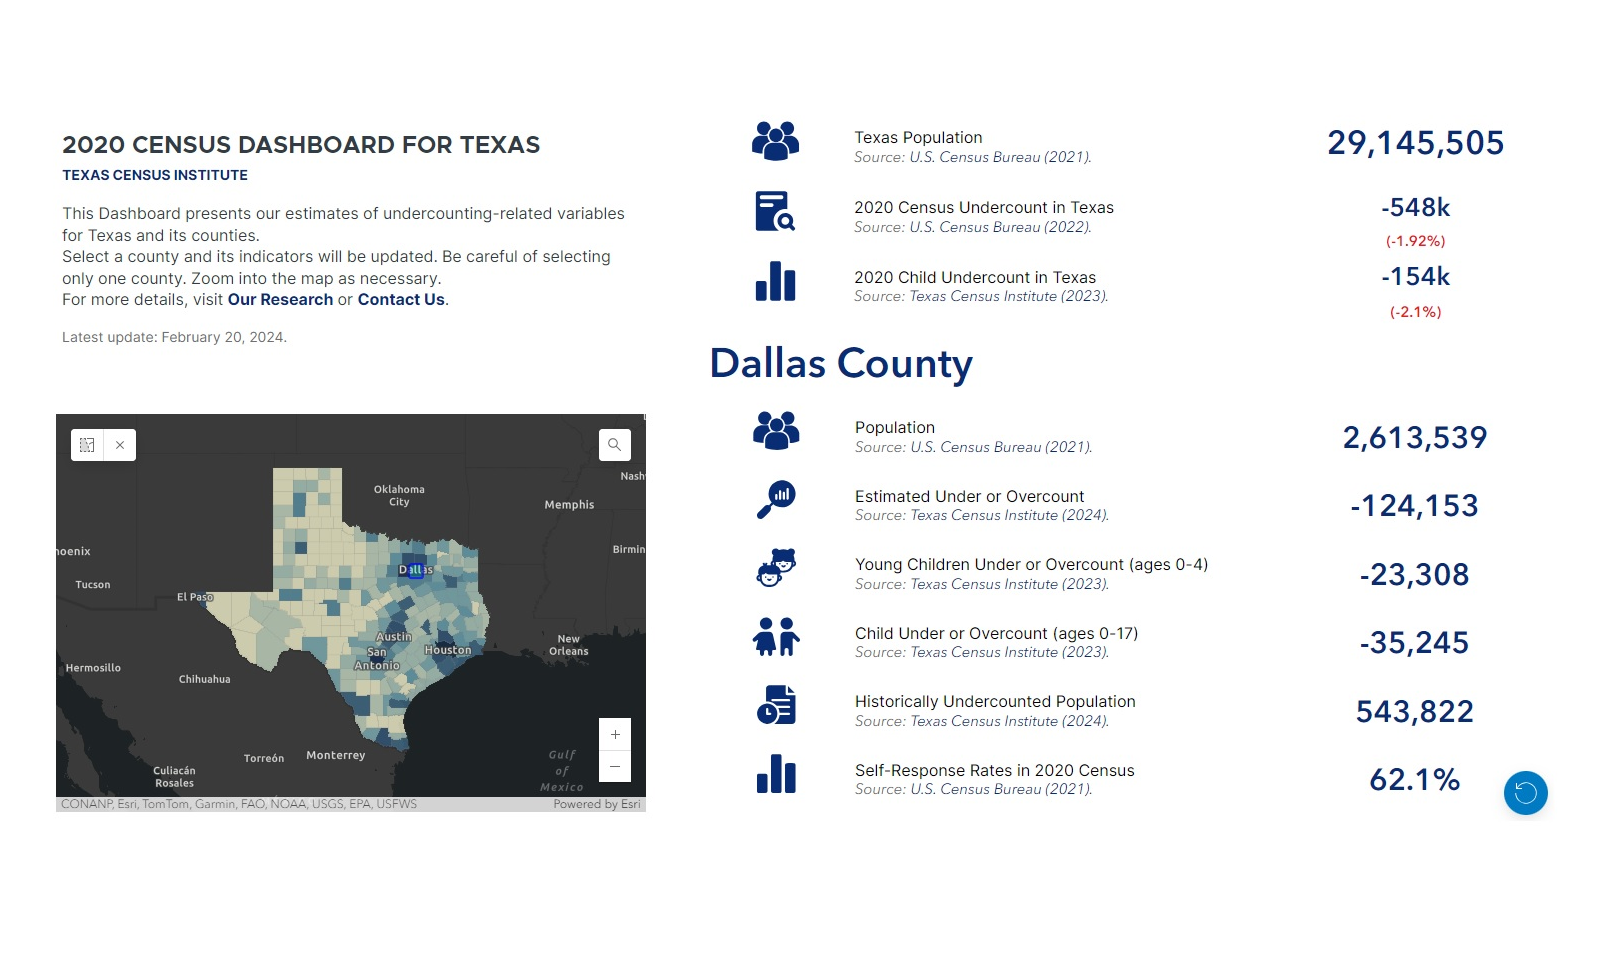
The 2020 Census undercounted an estimated 153,633 children in Texas.
190 out of 254 Texas counties (74.8%) experienced a net child undercount.
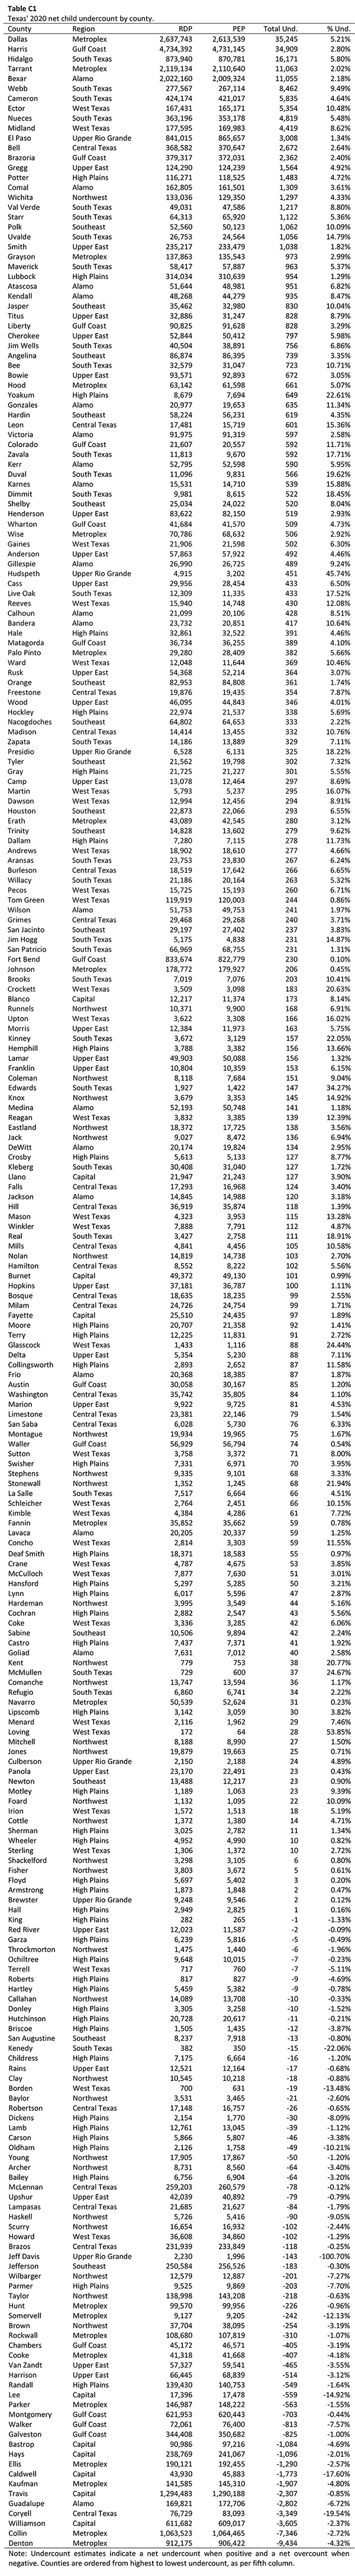
Dallas County, in the Metroplex region, experienced the largest county undercount (35,245 children).
71.8% of child undercount in Texas occurs in three of its twelve regions: South Texas, Gulf Coast, and Metroplex.
Figure 1 Net child undercount in Texas counties
Note: Color bins identify each region. A darker red color indicates higher undercounting. A darker blue color indicates higher overcounting. Negative and positive values indicate undercounting and overcounting, respectively.
Our Contribution
Little is known about child undercounting at the county level in the 2020 Census. To inform this issue, we estimated the Texas county-level net child undercount and studied its spatial distribution using data from the 2020 Census and the Vintage 2020 population estimates.
Introduction
The net undercount of children (aged 0 to 17) in the U.S. Census is high and has grown in recent decades. Based on the U.S. Census Bureau’s Demographic Analysis (DA), the net undercount of children in the U.S. Census increased from 1.7% in 2010 to 2.1% in 2020. The 2.1% net undercount of children in the 2020 Census contrasts with a 0.2% overcount for adults. An overcount exists when the census results are higher than the population estimated by another source. This pattern is consistent with the 2010 Census, when children had a net undercount, and adults had a net overcount.1
While these national numbers are informative, local data from the decennial census are critical because the decennial census is one of the few sources of relatively comparable data for all communities in the nation. In many ways, the decennial census is the bedrock of our national statistical system. The decennial census has many uses.2,3 Including:
Allocation of federal funds,
Controls for Census Bureau surveys,
Community development,
Business planning,
Enforcing government regulations,
Academic research, and
Business research.
Therefore, local census information is important, in part, because state and county data are used in many of the formulas to allocate federal funding for 353 federal programs that distributed more than $2.8 trillion in federal funds in Fiscal Year 2021.4 Furthermore, in a similar exercise for 2017, Andrew Reamer found that about two-thirds of the formulas use substate geographic units, making county data especially important.5
This study employs a commonly used demographic benchmark to identify counties with high net undercounts of children in the 2020 Census. Specifically, the county-level children estimate from the Vintage 2020 population estimates is compared to its corresponding figure from the 2020 Census.6,7 The Vintage 2020 population estimates are calculated using the 2010 Census results as a base and adding births, deaths, and net migration between 2010 and 2020.
This study builds on the work of William P. O’Hare, who finds Texas had more counties with high net undercounts of children than any other state (either in number or rate terms).8 In doing so, this brief presents the net child undercount estimates for all Texas counties, not only for those with the highest numbers and rates. Hence it includes estimates for the net child undercount rates and net child undercount numeric size in each county. It is worth noting that the net undercount is not the same as the number of people missed in the census. The net undercount includes people missed as well as people double counted. In 2010, the total number of children missed was about double the size of the net undercount, so this distinction is significant.9 In this paper, net undercount is sometimes called “undercount” for simplicity.
In sum, this paper’s contribution is twofold. First, it makes child undercount data for Texas counties easily available to the public. Second, it explores the Texas net child undercount in its twelve regions (Alamo, Capital, Central Texas, Gulf Coast, High Plains, Metroplex, Northwest, South Texas, Southeast, Upper East, Upper Rio Grande, and West Texas), which are regions created by the Texas Comptroller (see more details at comptroller.texas.gov).
Data and Methodology
We use two 2020 county-level products of the U.S. Census Bureau with data on children: the Vintage 2020 population estimates and the 2020 Census. At the time this analysis was conducted, the only data on children from the 2020 Census was the population ages 0 to 17. Undercounted children are estimated by subtracting the population estimates from the census count. There are two reasons to believe the population estimates are more accurate than the census count. First, the 2020 census count had a high net undercount of children. Second, the population estimates for children are based largely on birth certificate data which is quite accurate.
The U.S. Census Bureau provides annual population and housing estimates through its Population Estimates Program. The version of the Vintage estimates used here is that of April 2020. As per its methodological approach, it is a simplified version of the U.S. Census Bureau’s Demographic Analysis. On the other hand, the county-level estimates from the 2020 Census come from the 1975 Public Law 94-171, which “…directs the U.S. Census Bureau to make special preparations to provide redistricting data needed by the 50 states.”7 In particular, “Required by law, the Redistricting Data Program provides states the opportunity to specify the small geographic areas for which they wish to receive decennial population totals for the purpose of reapportionment and redistricting”10.
This paper follows O’Hare’s approach to estimating child undercounts at the county level. In a few words, the net child undercount is the difference between the 2020 Census and the Vintage estimates children count as a percentage of the Vintage estimates’ child count. When the 2020 Census is smaller than the Vintage 2020 estimates, we observe an undercount (expressed with a negative undercount estimate), and when the 2020 Census is higher than the Vintage 2020 estimates, we observe an overcount (with a positive undercount estimate). Then, net child undercounts are reflected with negative values and net child overcounts are reflected in positive values.
Results
County-level Analysis
We estimate that 153,633 out of 7,432,438 children (2.1%) in the Texas 2020 Vintage population estimates were undercounted by the 2020 Census. The full data table by county and visualization tools on net child undercount are available at texascensus.org. Figure 1 shows that 190 of Texas counties experienced a net child undercount (74.8%), and 64 observed an overcount (25.2%).
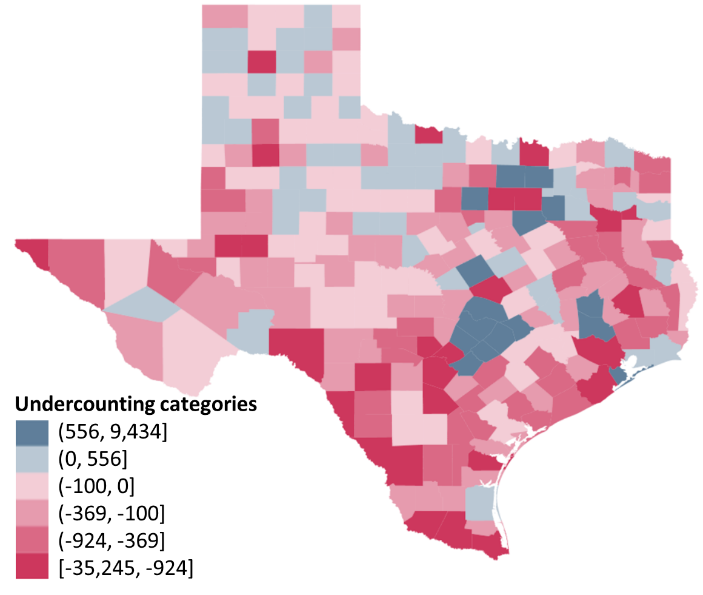
Figure 1 Net child undercount in Texas counties
a) Net child undercount number (total)
b) Net child undercount rate (%)
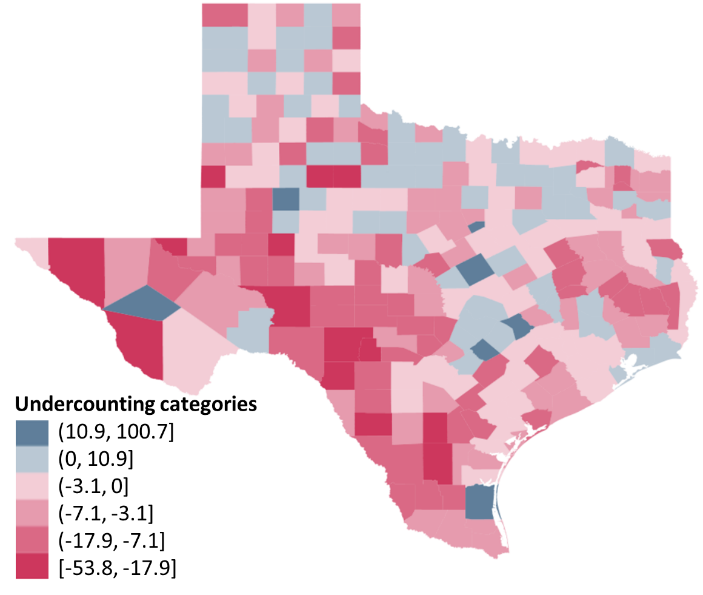
Note: A darker red color indicates higher undercounting. A darker blue color indicates higher overcounting. Negative and positive values indicate undercounting and overcounting, respectively.
Texas counties experienced an average child undercount of 605 children and an average rate of 3.8% child undercount by county. Nevertheless, coverage rates for children in Texas counties range from a net undercount of 35,245 in Dallas County to a net overcount of 9,434 in Denton County. In terms of net coverage rates, they range from a net child undercount of 53.8% in Loving County to a net child overcount of 100.7% in Jeff Davis County. Panel a) in Figure 1 shows how net child undercount numbers tend to be higher in counties in the South Texas region, and child overcounts are generally concentrated in the Capital and Metroplex regions. Panel b) in Figure 1 accentuates some of these patterns. For instance, it shows how the net undercounted children rate is predominantly higher in counties on the U.S.-Mexico border and those close to it. In sum, high net child undercount rates tend to cluster in the South Texas and West Texas regions.
Regional Analysis
The county-level clustering observed in Figure 1 raises different questions. For instance, is Child Undercounting a regional phenomenon? When estimating the net child undercount in numbers by region, the highest values are also present in the south, where the South Texas region is located (see Figure 2).
However, this time, it is possible to observe the presence of a high child undercount in the Gulf Coast and Metroplex regions. Seven of every ten children undercounted in Texas are from these three regions, with a combined child undercount of 110,338 (71.8% of the 153,633 children undercounted in the state).
About one of every three children undercounted in Texas is from the South Texas region, with an undercount of 45,425, representing 29.6% of the state child undercount (153,633).
Figure 2 Net child undercount number in Texas regions (total)
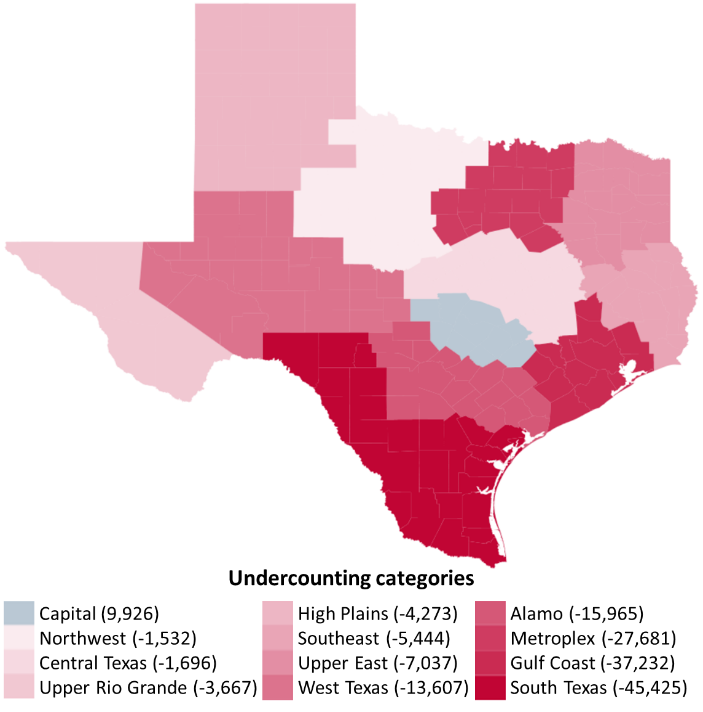
Note: A darker red color indicates higher undercounting. A darker blue color indicates higher overcounting. Negative and positive values indicate undercounting and overcounting, respectively.
Similarly, one of every four children undercounted in Texas is from the Gulf Coast region, with an undercount of 37,232 (24.2% of the state child undercount). Moreover, one of every five children undercounted in Texas is from the Metroplex region, with an undercount of 27,681 (18.0% of the state child undercount).
When studying the child undercount rates by region, Figure 3 shows how the child undercount rate is predominantly higher in West Texas and South Texas, which have many counties on the U.S.-Mexico border.
The relatively higher child undercount rate in some regions might arise because their counties have less total child population; therefore, total child undercounts represent a higher rate. A deeper regional exploration of the determinants of child undercount is necessary to convey a set of definite explanations for this phenomenon. The geographical dispersion of counties’ and regions’ child undercounts provide suggestive evidence of higher child undercounts close to the U.S.-Mexico border, the Gulf Coast region, and eastern Texas counties.
Figure 3 Net child undercount rate in Texas regions (%)
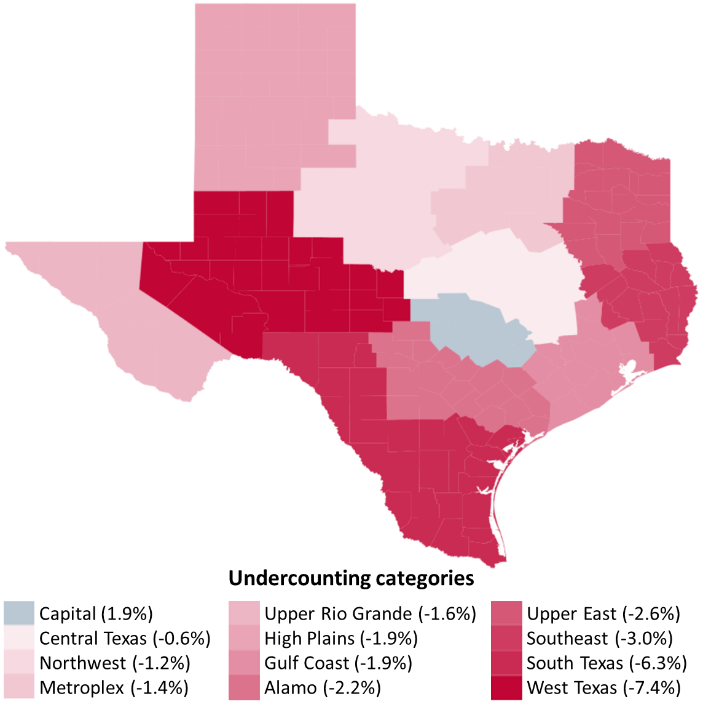
Note: Color bins identify each region. A darker red color indicates higher undercounting. A darker blue color indicates higher overcounting. Negative and positive values indicate undercounting and overcounting, respectively.
Concluding remarks
Census data is used for a wide range of public and private functions, but little is known about the undercount of children at the county level. This study provides a detailed analysis of child undercounts at the county and regional level in Texas and explores its regional patterns. These results are not intended to be definite but to serve as a stepping stone for deeper analysis in Texas with child undercounts. Moreover, this paper aims to encourage the pursuit of community-based participatory research to better understand the determinants of child undercount in Texas counties.
It is important to emphasize the policy relevance of this study. Many state programs use census-related data to determine the distribution of federal funds.4,5,11 Counties with a high undercount of children do not have the accurate data they need for planning things like schools, healthcare facilities, and childcare centers. Additionally, they will not get their share of federal and state government resources that are allocated based on census count.
To address the financial impact of an undercount, leaders in counties with a high undercount of children may approach Texas state administrators to explore ways to compensate counties that experience a high undercount of children. Similarly, county officials and leaders in counties with a high undercount of children may want to urge the Census Bureau to look for additional ways to correct the undercount of children in future censuses. The results shown here can be used to start building a targeted approach to increasing the count accuracy of children in the 2030 Census. It is time to start building the infrastructure that could help reduce the undercounting of children in the 2030 Census.
Author’s Message
The net undercount of children (age 0 to 17) in the U.S. Census is high and has been growing in recent decades. This study provides a detailed analysis of child undercounts at the county and regional level in Texas and explores its regional patterns. These results can serve as a roadmap for deeper analysis.
Census-related data is used to determine the distribution of funding for 350+ federal programs, totaling more than $2.8 trillion each year. Counties with an undercount will not receive the full federal funding they are entitled to, impacting budgets for things like schools, health centers, and childcare centers. Furthermore, counties with an undercount will not have accurate data for future planning.
To address the impact of an undercount, leaders may want to explore ways to compensate counties that experience a high undercount of children. Similarly, leaders in counties with a high undercount of children may want to work with the Census Bureau to look for additional ways to correct the undercount of children in future censuses. The results shown here can be used to start building a targeted approach to increasing the count accuracy of children in the 2030 Census.
Acknowledgements: The authors appreciate the insightful support provided by Helen You, Deborah Stein, and Monica Cruz.
Tags:
FAQ
1) Why does the U.S. Census Bureau not publish undercounting and overcounting estimates at the county level for children?
As it is well known, the U.S. Census Bureau assesses the quality (undercounting or overcounting) of its Decennial Census using the Post-Enumeration Survey (PES) and the Demographic Analysis (DA).
The PES was implemented in 2020 by characteristics of the housing units only to the national and state levels. The PES uses the location of the housing units to obtain results at the subnational level, but it does not consider demographic characteristics such as age or gender. Moreover, “…the sample size for the 2020 PES and the assumptions required to make unbiased sub-state estimates, the Census Bureau was unable to include county or place estimates in the 2020 PES reports, as well.” (U.S. Census Bureau, 2022).
On the other hand, the Demographic Analysis uses “…current and historical vital records, data on international migration, and Medicare records to produce national estimates of the population on April 1 by age, sex, the DA race categories, and Hispanic origin.” (U.S. Census Bureau, 2022). While the DA is rich in demographic characteristics, it cannot identify the current place of residence of the population since a great part of it is based on vital records. Therefore, due to its nature, the official undercounting or overcounting by demographic characteristics is estimated at the national level only.
Therefore, it is not possible to obtain an official undercounting and overcounting estimate at the county level for children.
2) Why are we using counties as geographies?
This approach implies that undercounting estimation is built upon variables that are considered determinants of undercounting, according to the theory.
3) How accurate or precise are our net child undercount estimates?
While there is no statistical measure of accuracy or precision for our estimates, they were built using official publicly available data from the U.S. Census Bureau.